Earnings summaries and quarterly performance for Cencora.
Executive leadership at Cencora.
Board of directors at Cencora.
Research analysts who have asked questions during Cencora earnings calls.
Charles Rhyee
TD Cowen
8 questions for COR
Elizabeth Anderson
Evercore ISI
8 questions for COR
Eric Percher
Nephron Research
8 questions for COR
Erin Wright
Morgan Stanley
8 questions for COR
George Hill
Deutsche Bank
8 questions for COR
Kevin Caliendo
UBS
8 questions for COR
Lisa Gill
JPMorgan Chase & Co.
8 questions for COR
Allen Lutz
Bank of America
7 questions for COR
Daniel Grosslight
Citigroup
7 questions for COR
Steven Valiquette
Mizuho
7 questions for COR
Michael Cherny
Leerink Partners
5 questions for COR
Michael Cherney
Jefferies Financial Group Inc.
3 questions for COR
Eric Coldwell
Robert W. Baird & Co.
2 questions for COR
Stephen Baxter
Wells Fargo & Company
2 questions for COR
Stephen Baxter
Wells Fargo
2 questions for COR
Glenn Santangelo
Barclays
1 question for COR
Glen Santangelo
Jefferies
1 question for COR
Jack Slevin
Jefferies Financial Group Inc.
1 question for COR
Stephanie Davis
Barclays
1 question for COR
Recent press releases and 8-K filings for COR.
- Cencora completed the acquisition of a majority equity interest in One Oncology, integrating its MSO platform with Retina Consultants of America to strengthen its specialty pharmacy and provider services capabilities.
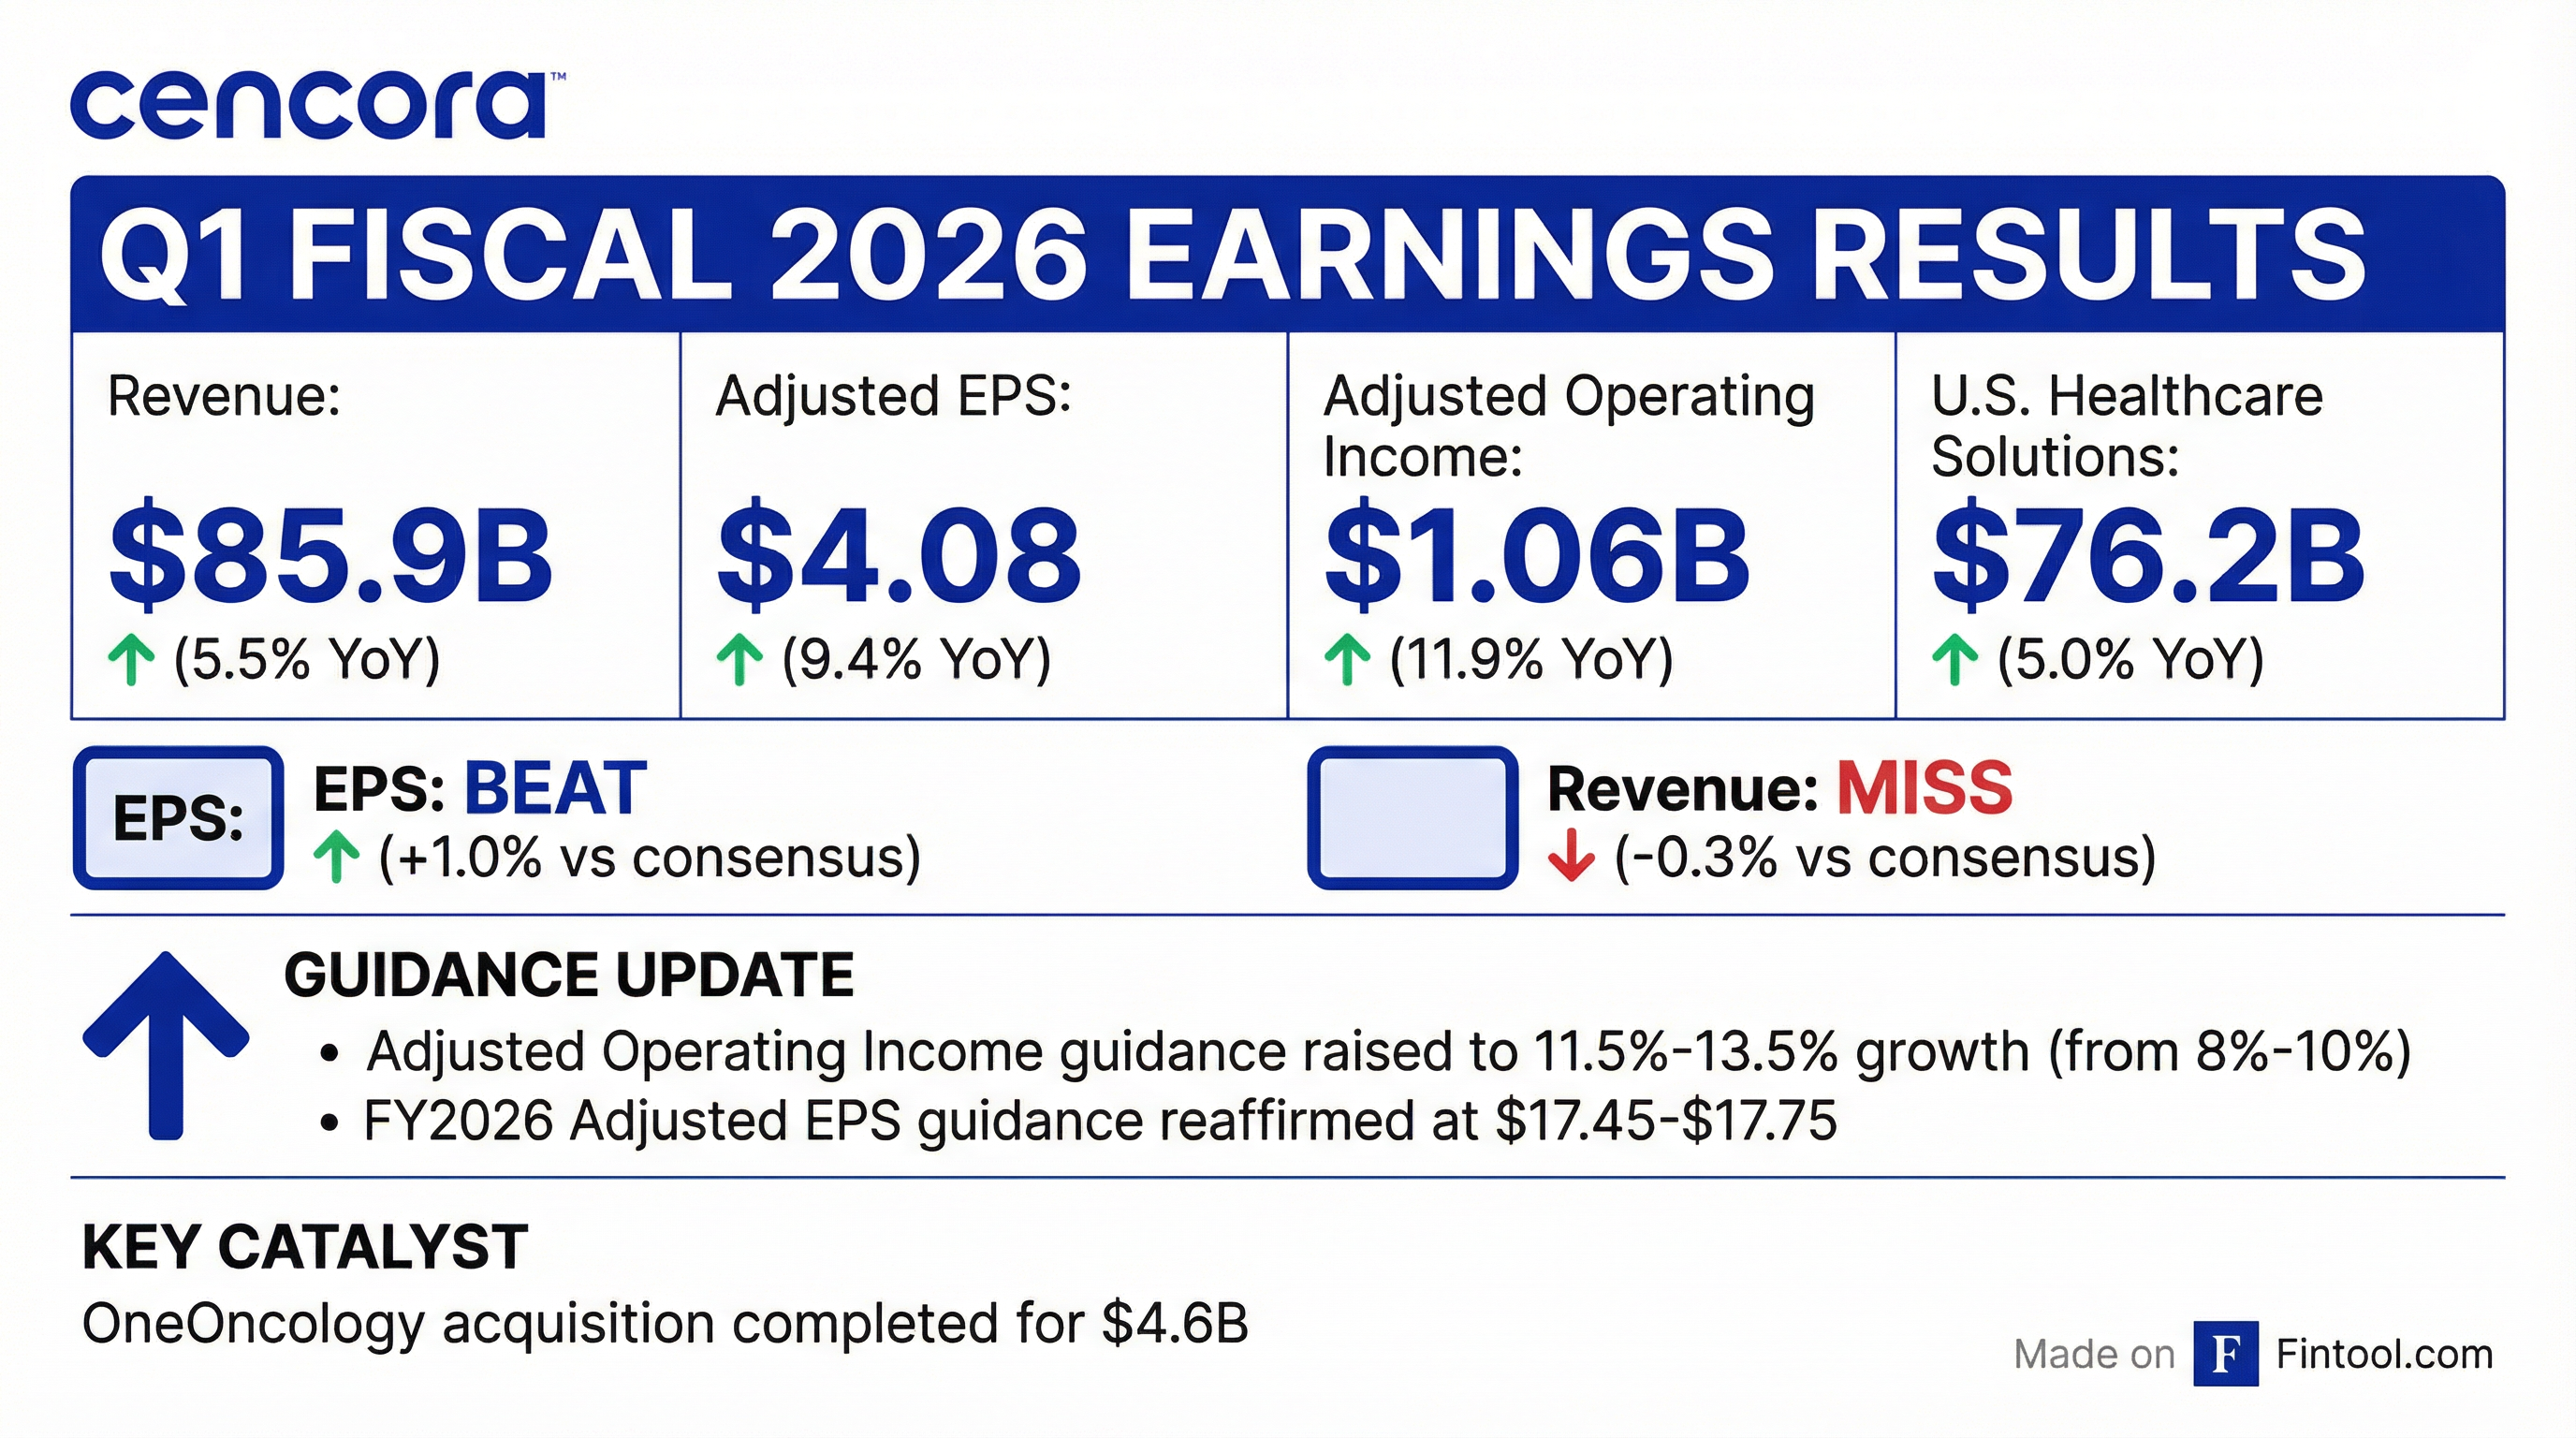
- In Q1 2026, Cencora reported adjusted diluted EPS of $4.08 (up 9%), revenue of $85.9 billion (up 5.5%), gross profit of $3.0 billion (up 18%), and operating income of $1.1 billion (up 12%); the company ended the quarter with $1.8 billion in cash and negative adjusted free cash flow of $2.4 billion due to seasonal working capital dynamics.
- Cencora raised full-year fiscal 2026 guidance to $17.45–$17.75 adjusted EPS, 11.5%–13.5% operating income growth, and 7%–9% consolidated revenue growth, reflecting One Oncology’s contribution and ongoing strength in U.S. Healthcare Solutions.
- The expanded MSO footprint supports Cencora’s growth priorities—specialty leadership, partnering with market leaders, and enhancing patient access—through advanced analytics, clinical research, and operational excellence.
- Completed majority acquisition of One Oncology and integrated with RCA to expand specialty pharmaceutical MSO capabilities and patient access.
- Reported in Q1 FY2026 revenue of $85.9 billion (+5.5%), adjusted EPS of $4.08 (+9%), and adjusted operating income of $1.1 billion (+12%).
- U.S. Healthcare Solutions: $76.2 billion revenue (+5%), $831 million operating income (+21%); International: $7.6 billion revenue (+10% reported, +6% cc), $142 million operating income (-14% reported, -17% cc); Other: $2.1 billion revenue (+6%), $91 million operating income (-6%).
- Raised FY2026 guidance: consolidated revenue growth to 7%–9%, adjusted operating income growth to 11.5%–13.5%, reaffirmed adjusted EPS at $17.45–$17.75, and interest expense now expected at $480–$500 million.
- Completed acquisition of a majority stake in OneOncology and raised fiscal 2026 adjusted operating income growth guidance to 11.5%–13.5%, EPS guidance to $17.45–$17.75, and revenue growth to 7%–9%.
- Delivered Q1 adjusted diluted EPS of $4.08 (+9%) and consolidated revenue of $85.9 billion (+5.5%); gross profit was $3.0 billion (+18%) and operating income $1.1 billion (+12%).
- U.S. Healthcare Solutions revenue rose to $76.2 billion (+5%) with operating income of $831 million (+21%); International Healthcare Solutions posted revenue of $7.6 billion (+10% as-reported; +6% cc) and operating income of $142 million (–14% as-reported; –17% cc).
- Ended Q1 with $1.8 billion in cash and negative adjusted free cash flow of $2.4 billion (vs –$2.8 billion a year ago); full-year free cash flow is expected to be ~$3 billion. Share repurchases are paused and diluted share count is projected at 195.5 million.
- Consolidated revenue was $85.9 billion, up 5.5% year-over-year; adjusted diluted EPS was $4.08, up 9.4%( ).
- Fiscal 2026 adjusted operating income guidance raised to 11.5%–13.5% growth, up from 8%–10%( ).
- Completed acquisition of the remaining equity interests in OneOncology on February 2, 2026( ).
- Declared a quarterly cash dividend of $0.60 per share( ).
- Cencora reported Q1 revenue of $85.9 billion, up 5.5% YoY, with GAAP diluted EPS of $2.87 and adjusted diluted EPS of $4.08.
- The company raised its full-year adjusted operating income guidance to growth of 11.5%–13.5% and reaffirmed adjusted diluted EPS guidance of $17.45–17.75.
- Cencora completed the acquisition of OneOncology, expanding its specialty MSO footprint in cancer care.
- The Board declared a $0.60 quarterly cash dividend per share, payable March 2, 2026.
- Revenue in the first quarter of fiscal 2026 was $85.9 billion, up 5.5% year-over-year; GAAP diluted EPS was $2.87 and adjusted diluted EPS was $4.08.
- Adjusted operating income guidance for fiscal 2026 was raised to growth of 11.5%–13.5%, while the full-year adjusted diluted EPS range of $17.45–$17.75 was reaffirmed.
- Cencora completed the acquisition of OneOncology, expanding its specialty MSO footprint in oncology care.
- In Q1, U.S. Healthcare Solutions revenue grew 5.0% and International Healthcare Solutions revenue grew 9.6% year-over-year.
- On January 12, 2026, Cencora agreed to a $3.0 billion 364-Day Term Credit Facility with Citibank, N.A. as administrative agent to finance its acquisition of OneOncology, repay existing debt and cover related fees.
- The term loan matures 364 days after drawdown and bears interest at Term SOFR or Daily Simple SOFR plus 87.5–112.5 bps, or an alternate base rate plus 0–12.5 bps, based on the company’s public debt ratings.
- Unused commitments under the facility will incur a ticking fee of 6–10 bps per annum starting April 1, 2026, also determined by public debt ratings.
- The agreement includes customary covenants mirroring the Revolving Credit Agreement, including a maximum leverage ratio of 4.00 to 1.00, with an optional increase to 4.50 to 1.00 following a material acquisition, and restrictions on indebtedness, liens, fundamental changes and asset sales.
- The company can prepay the term loan in whole or in part at any time without penalty (aside from any applicable breakage costs) and may reduce commitments at its discretion.
- Cencora plans to accelerate the acquisition of OneOncology, aligning it with Retina Consultants of America to capture synergies in clinical trials, back-office support and data analytics across its MSO platform.
- The company raised its long-term operating income growth outlook to 7–10% and adjusted diluted EPS growth to 10–14%, driven by specialty distribution strength and MSO contributions.
- Management announced a $1 billion investment in supply chain infrastructure—including expanded cold-chain capacity—through 2030 to bolster its global specialty logistics and 3PL offerings.
- For fiscal 2026, Cencora guided to 8–10% consolidated adjusted operating income growth and 9–11% growth in its U.S. Healthcare Solutions segment, reflecting ongoing specialty and MSO momentum.
- Fiscal 2025 revenue of $321 B (+9% y-o-y), adjusted operating income of $4.2 B (+16%), adjusted diluted EPS of $16.00 (+16%), and adjusted free cash flow of $3.0 B.
- Raised long-term guidance for adjusted operating income and diluted EPS to reflect strength in U.S. Healthcare Solutions and expected contribution from OneOncology.
- Outlined strategic priorities to lead in specialty pharmaceuticals, enhance patient access through data & technology, and pursue growth-oriented investments targeting 10–14% long-term adjusted EPS growth on a constant currency basis.
- Completed acquisition of Retina Consultants of America, announced intent to accelerate OneOncology acquisition, and committed $1 B to supply chain infrastructure investment through 2030.
- Emphasized global platform expansion as a pan-European wholesaler and premier specialty logistics provider, leveraging MSOs to deepen downstream services and clinical trial support.
- Cencora detailed four strategic drivers—digital transformation, talent development, productivity enhancements, and prioritized growth investments—and designated an “other” segment comprising MWI Animal Health, Brazil’s Profarma, its legacy U.S. patient-hub business, and parts of PharmaLex.
- The company completed its acquisition of Retina Consultants of America and announced plans to accelerate the full purchase of OneOncology, targeting synergies in clinical trials, back-office support (revenue cycle, staffing, IT), and long-term data & analytics.
- Cencora plans a $1 billion investment in supply-chain infrastructure through 2030—expanding overall and cold-chain capacity—and is boosting its global specialty logistics and 3PL offerings.
- Management has raised long-term targets twice in recent months: operating income growth from 5–8% to 6–9%, then to 7–10% (plus 3–4% from capital deployment), and adjusted EPS from 8–12% to 9–13%, then to 10–14%, reflecting strong U.S. Healthcare Solutions performance and the OneOncology deal.
- Fiscal 2026 guidance calls for consolidated operating income growth of 8–10% (U.S. Healthcare Solutions: 9–11%) and International segment growth of 5–8%; share repurchases are paused pending OneOncology integration and debt reduction.
Quarterly earnings call transcripts for Cencora.
Ask Fintool AI Agent
Get instant answers from SEC filings, earnings calls & more