Earnings summaries and quarterly performance for OLD DOMINION FREIGHT LINE.
Executive leadership at OLD DOMINION FREIGHT LINE.
Kevin Freeman
President and Chief Executive Officer
Adam Satterfield
Executive Vice President, Chief Financial Officer and Assistant Secretary
Cecil Overbey Jr.
Senior Vice President - Strategic Development
Christopher Brooks
Senior Vice President - Human Resources & Safety
Christopher Kelley
Senior Vice President – Operations
David Congdon
Executive Chairman
Gregory Plemmons
Executive Vice President and Chief Operating Officer
Ross Parr
Senior Vice President - Legal Affairs, General Counsel and Secretary
Steven Hartsell
Senior Vice President – Sales
Board of directors at OLD DOMINION FREIGHT LINE.
Andrew Davis
Director
Bradley Gabosch
Director
Cheryl Miller
Director
Debra King
Director
Greg Gantt
Director
John Congdon Jr.
Director
John Kasarda
Lead Independent Director
Sherry Aaholm
Director
Thomas Stith III
Director
Wendy Stallings
Director
Research analysts who have asked questions during OLD DOMINION FREIGHT LINE earnings calls.
Jason Seidl
TD Cowen
10 questions for ODFL
Jonathan Chappell
Evercore ISI
10 questions for ODFL
Jordan Alliger
Goldman Sachs
10 questions for ODFL
Ken Hoexter
BofA Securities
10 questions for ODFL
Ravi Shanker
Morgan Stanley
10 questions for ODFL
Scott Group
Wolfe Research
10 questions for ODFL
Bascome Majors
Susquehanna Financial Group
8 questions for ODFL
Christian Wetherbee
Wells Fargo
8 questions for ODFL
Eric Morgan
Barclays
8 questions for ODFL
Richa Harnain
Deutsche Bank
8 questions for ODFL
Stephanie Moore
Jefferies
8 questions for ODFL
Tom Wadewitz
UBS Group
7 questions for ODFL
Ariel Rosa
Citigroup
6 questions for ODFL
Brian Ossenbeck
JPMorgan Chase & Co.
6 questions for ODFL
Daniel Imbro
Stephens Inc.
6 questions for ODFL
J. Bruce Chan
Stifel
6 questions for ODFL
Reed Seay
Stephens Inc.
4 questions for ODFL
Jeffrey Kauffman
Vertical Research Partners
3 questions for ODFL
Thomas Wadewitz
UBS
3 questions for ODFL
Ari Rosa
Citigroup Inc.
2 questions for ODFL
Brandon Oglenski
Barclays
2 questions for ODFL
Bruce Chan
Stifel Financial Corp.
2 questions for ODFL
Christopher Kuhn
The Benchmark Company
2 questions for ODFL
Jeff Kauffman
Vertical Research
2 questions for ODFL
Chris Wetherbee
Wells Fargo & Company
1 question for ODFL
Chris Wetherby
Wells Fargo
1 question for ODFL
Joe Hafling
Jefferies
1 question for ODFL
Tyler Brown
Raymond James Financial, Inc.
1 question for ODFL
Recent press releases and 8-K filings for ODFL.
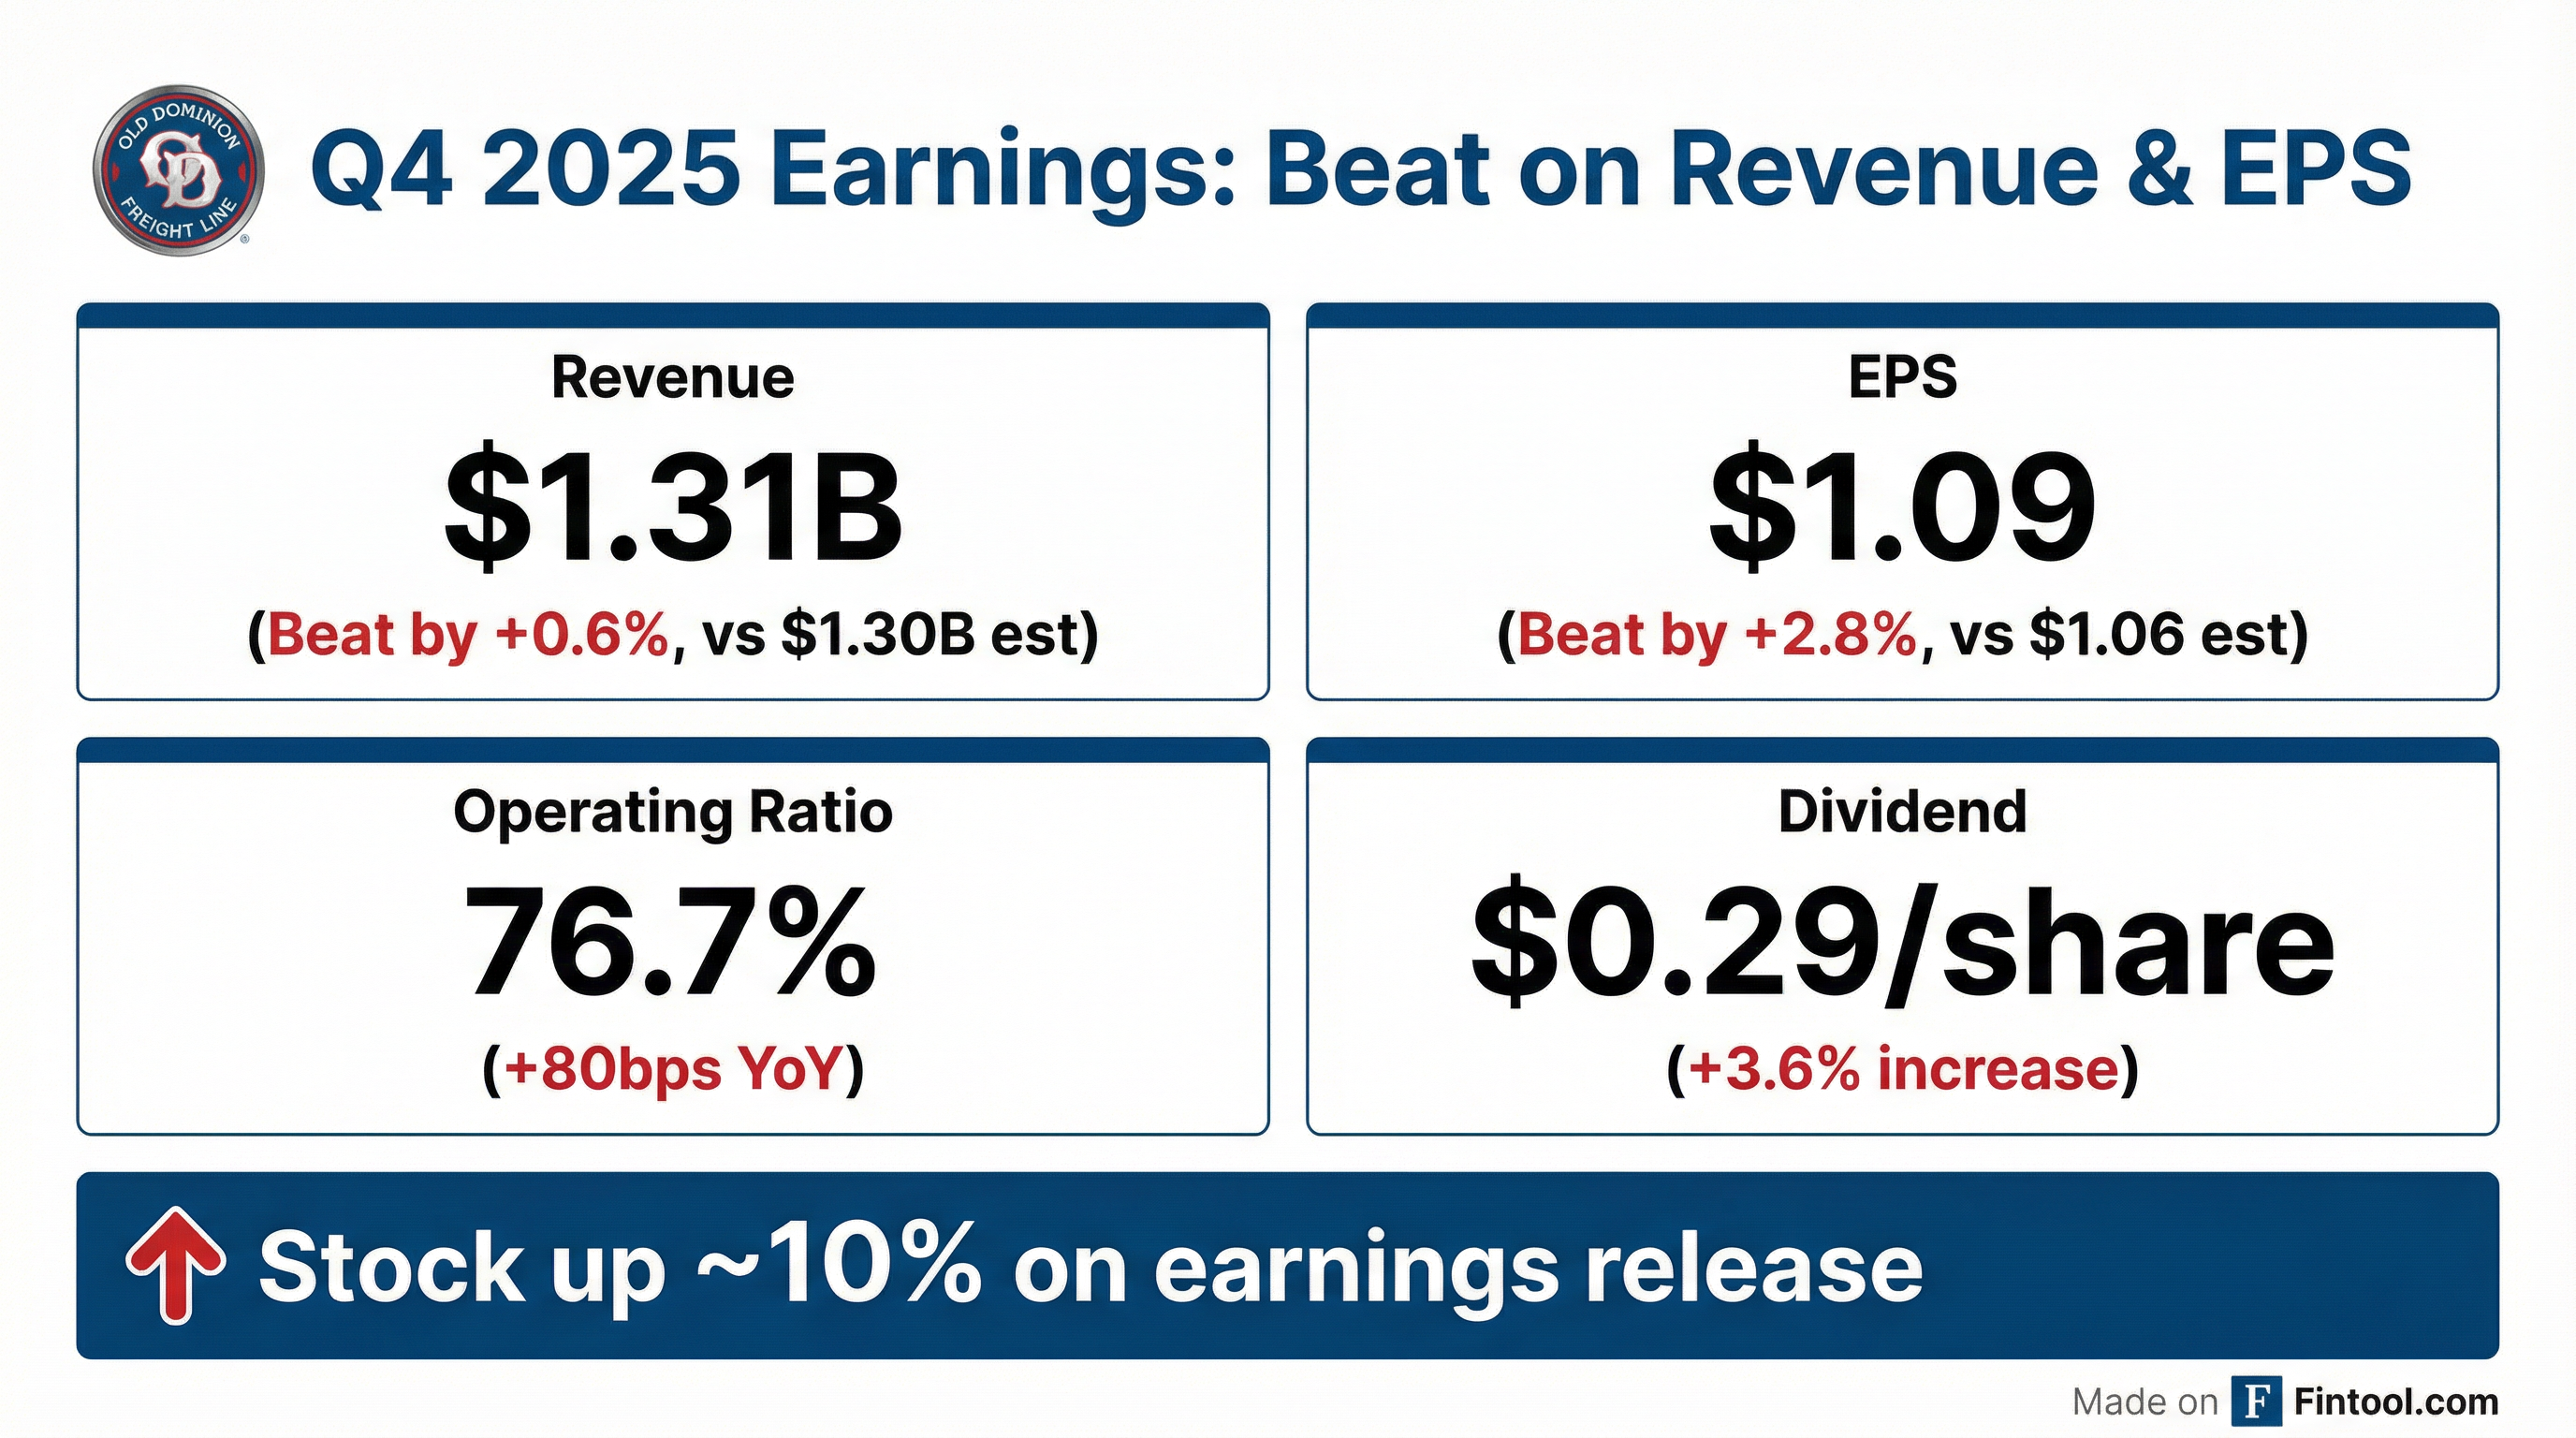
- Revenue of $1.31 billion in Q4 2025, down 5.7% year-over-year, driven by a 10.7% decline in LTL tons per day partially offset by a 5.6% increase in LTL revenue per hundredweight (4.9% ex-fuel); operating ratio widened to 76.7% (+80 bps).
- Maintained best-in-class service with 99% on-time performance and a 0.1% cargo claims ratio, while leveraging technology and cost discipline to keep direct operating costs at 53% of revenue despite lower network density.
- Generated $310.2 million of cash from operations in Q4; deployed $124.9 million to share repurchases and $58.4 million to dividends, with the Q1 2026 dividend raised 3.6% to $0.29 per share.
- Provided Q1 2026 guidance of $1.25–1.30 billion in revenue and a sequential operating ratio increase of ~150 bps, expressing cautious optimism about demand recovery amid capacity readiness.
- Revenue of $1.31 billion, down 5.7% year-over-year; operating ratio increased to 76.7%
- Delivered 99% on-time service and 0.1% cargo claims ratio, underscoring service quality
- Generated $310.2 million cash from operations in Q4; capex of $45.7 million; share repurchases of $124.9 million; dividends paid of $58.4 million
- Declared a $0.29 per share dividend for Q1 2026 (up 3.6%); effective tax rate was 24.8% in Q4
- Revenue of $1.31 billion, down 5.7% y/y, driven by a 10.7% decline in LTL tons/day partially offset by a 5.6% increase in LTL revenue per hundredweight.
- Operating ratio of 76.7%, up 80 bps y/y, with direct operating costs at 53% of revenue and overhead costs rising 140 bps due to deleveraging and increased depreciation.
- Cash flow from operations of $310.2 million; capex of $45.7 million; returned $124.9 million to shareholders via share repurchases and paid $58.4 million in dividends in Q4 2025.
- Q1 2026 guidance: revenue expected between $1.25 billion and $1.30 billion, operating ratio to rise ~150 bps, and quarterly dividend set at $0.29 per share (+3.6% y/y).
- Reported Q4 2025 revenue of $1.307 B (down 5.7% YoY) and EPS of $1.09, with net income of $229.5 M (12.8% decrease).
- Declared a Q1 2026 cash dividend of $0.29 per share, a 3.6% increase from Q1 2025.
- Operating ratio rose to 76.7% in Q4 2025 from 75.9% a year ago.
- Generated $310.2 M of net cash from operations in Q4 and incurred $45.7 M in capital expenditures; 2026 capex guidance approx $265 M.
- Returned capital via $730.3 M of share repurchases and $235.6 M in dividends during 2025.
- Old Dominion posted a 4.4% decline in November 2025 revenue per day, driven by a 10.0% drop in LTL tons per day amid economic softness.
- LTL volume pressures stemmed from a 9.4% decrease in daily shipments and a 0.6% decline in weight per shipment.
- Effective yield management drove a 5.9% increase in LTL revenue per hundredweight quarter-to-date (5.2% ex-fuel), highlighting pricing resilience.
- The company maintains strong profitability, over 250 service centers and 11,000 tractors, and retains a Buy rating with a $170 target despite revenue headwinds.
- November 2025 revenue per day fell 4.4% year-over-year, driven by a 10.0% decline in LTL tons per day.
- The drop in tons per day was due to a 9.4% decrease in shipments per day and a 0.6% decrease in weight per shipment.
- Through the quarter-to-date, LTL revenue per hundredweight increased 5.9%, and excluding fuel surcharges rose 5.2%, year-over-year.
- CEO Marty Freeman cited domestic economic softness for lower volumes while emphasizing yield management and service quality as strategic priorities.
- The release contains a forward-looking statements disclaimer under the Private Securities Litigation Reform Act.
- Revenue was $1.41 billion, down 4.3% YoY, driven by a 9.0% drop in LTL tons/day partly offset by a 4.7% rise in revenue per hundredweight.
- Operating ratio rose 160 bps to 74.3% as lower volumes deleveraged fixed overhead and increased depreciation costs.
- Cash flow from operations was $437.5 million; capital expenditures totaled $94 million; share repurchases were $180.8 million; dividends paid amounted to $58.7 million in Q3.
- Early October trends show revenue/day down 6.5%–7% and LTL tons/day down 11.6%, implying a 250–350 bps sequential increase in operating ratio for Q4 if current trends persist.
- Q3 revenue of $1.41 billion, down 4.3% year-over-year; LTL tons/day –9.0%, partially offset by a 4.7% increase in yield per hundredweight.
- Operating ratio of 74.3%, a 160 bps increase year-over-year due to deleveraging from lower revenue and higher overhead and depreciation costs.
- Q3 operating cash flow of $437.5 million; capital expenditures of $94 million; share repurchases of $180.8 million; dividends of $58.7 million.
- Early-quarter demand remains weak: October revenue per day down 6.5–7%, LTL tons per day down 11.6%, reflecting continued softness.
- Revenue of $1.41 billion, down 4.3% YoY, reflecting a 9.0% decline in LTL tons/day partially offset by a 4.7% increase in yield.
- Operating ratio rose to 74.3% (+160 bps) due to deleveraging from lower revenue and increased overhead; direct costs were flat YoY.
- Cash flow from operations of $437.5 million, CapEx of $94 million, share repurchases of $180.8 million, and dividends of $58.7 million in Q3.
- Maintained 99% on-time service and 0.1% cargo claims, earning #1 national LTL provider designation for the 16th consecutive year and top rankings in 23 of 28 surveyed categories.
- Diluted EPS of $1.28, down 10.5% year-over-year in Q3 2025
- Total revenue of $1.406 billion, a 4.3% decrease from Q3 2024
- Operating income of $360.8 million with an operating ratio of 74.3%, up 160 bps year-over-year
- LTL tons per day fell 9.0%, while LTL revenue per hundredweight increased 4.7%, reflecting yield improvements amid volume softness
- YTD diluted EPS of $3.74 on $4.189 billion revenue, down 12.0% and 5.4%, respectively
Quarterly earnings call transcripts for OLD DOMINION FREIGHT LINE.
Ask Fintool AI Agent
Get instant answers from SEC filings, earnings calls & more