Earnings summaries and quarterly performance for SYSCO.
Executive leadership at SYSCO.
Kevin P. Hourican
Chair of the Board and Chief Executive Officer
Greg D. Bertrand
Executive Vice President, Global Chief Operating Officer
Jennifer K. Schott
Executive Vice President, Chief Legal Officer & Secretary
Kenny K. Cheung
Executive Vice President, Chief Financial Officer
Ronald L. Phillips
Executive Vice President, Chief Human Resources Officer
Thomas R. Peck, Jr.
Executive Vice President, Chief Information and Digital Officer
Board of directors at SYSCO.
Ali Dibadj
Director
Alison Kenney Paul
Director
Bradley M. Halverson
Director
Daniel J. Brutto
Director
Francesca DeBiase
Director
Jill M. Golder
Director
John M. Hinshaw
Director
Larry C. Glasscock
Lead Independent Director
Roberto Marques
Director
Sheila G. Talton
Director
Research analysts who have asked questions during SYSCO earnings calls.
Alexander Slagle
Jefferies
8 questions for SYY
Jeffrey Bernstein
Barclays
8 questions for SYY
John Heinbockel
Guggenheim Partners
8 questions for SYY
Jake Bartlett
Truist Securities
7 questions for SYY
John Ivankoe
JPMorgan Chase & Co.
7 questions for SYY
Edward Kelly
Wells Fargo
6 questions for SYY
Mark Carden
UBS
6 questions for SYY
Lauren Silberman
Deutsche Bank
3 questions for SYY
Kelly Bania
BMO Capital Markets
2 questions for SYY
Sara Senatore
Bank of America
2 questions for SYY
Brian Harbour
Morgan Stanley
1 question for SYY
Danilo Gargiulo
AllianceBernstein
1 question for SYY
Recent press releases and 8-K filings for SYY.
- Sysco reiterated FY 2026 guidance: sales growth of 3%–5% and adjusted EPS growth at the high end of 1%–3% (organic 5%–7%).
- U.S. Local Business posted +1.2% volume growth in the most recent quarter (+140 bps vs. prior quarter) and targets 2.5%+ volume growth in H2 FY 26 (100 bps organic improvement plus ~50 bps from the Tuck-In acquisition).
- International segment delivered nine consecutive quarters of double-digit profit growth, mid-single-digit volume growth, and has doubled its profit rate since 2020 through expanded fulfillment, Sysco Brand assortment and technology deployment.
- Plans to return approximately $2 billion to shareholders in FY 26 via ~$1 billion in dividends (56 years of consecutive increases) and ~$1 billion in share repurchases (started in Q3).
- Sysco forecasts FY26 net sales of $84.5 B (5% CAGR) and adjusted EPS of $4.59 (9% CAGR) in its three-year plan.
- U.S. local case volumes improved to +2.5% in Q2 FY26, with a 2H26 target of 2.5%+ growth (including ~100 bps sequential organic improvement).
- International segment net sales rose from $11.8 B in FY22 to $14.9 B in FY25 (8% CAGR), and adj. operating income grew at a 32% CAGR to $585 M in FY25, with FY26E of ~$680 M (4%+ margin).
- Capital allocation includes ~$2 B of returns in FY26 via share repurchases and a planned quarterly dividend of $0.54/share (6% growth YoY).
- Sysco reiterated FY 2026 guidance for sales growth of 3 – 5% and adjusted EPS growth at the high end of 1 – 3% (5 – 7% organic).
- U.S. Local Business posted +1.2% volume growth in the latest quarter and targets ≥ 2.5% local volume growth in 2H FY 2026, driven by improved colleague retention, AI 360 and sales programs like Sysco Your Way.
- International segment delivered 9 consecutive quarters of double-digit profit growth and mid-single-digit volume growth, doubling its profit rate since 2020 through enhanced fulfillment, tech deployment and a center-led merchandising model.
- Capital allocation priorities include ~$1 billion in annual dividends and ~$1 billion in share repurchases, supported by an investment-grade balance sheet and a target 9 – 11% total shareholder return.
- Sysco reaffirmed FY 2026 guidance of 3–5% sales growth and high-end 1–3% adjusted EPS growth (5–7% organically).
- Holds ~18% US food-away-from-home market share in a $377 billion TAM, with growth levers including a $10 billion specialty platform, $10 billion international opportunity, and faster broadline growth.
- International business posted 9 consecutive quarters of double-digit profit growth and remains on a similar growth curve to the US, about 10 years behind.
- Advancing strategic initiatives: AI 360 selling tools, closing a value-tier assortment gap, center-led merchandising driving hundreds of millions in procurement savings, supply-chain automation, and disciplined M&A.
- Committed to returning ~$2 billion to shareholders in FY 2026 via dividends and buybacks, maintaining an IG-rated balance sheet, targeting 9–11% long-term TSR with a 40–50% dividend payout.
- Sysco Corporation issued and sold $600 million of 4.400% Senior Notes due July 25, 2031 and $650 million of 4.950% Senior Notes due March 25, 2036 under its Form S-3ASR registration statement.
- The notes were issued pursuant to the June 15, 1995 Base Indenture, as supplemented by the Thirteenth, Forty-Eighth and Forty-Ninth Supplemental Indentures, with U.S. Bank Trust Company, N.A. appointed trustee for these series.
- Interest is payable semi-annually (January 25/July 25 for the 2031 Notes and March 25/September 25 for the 2036 Notes), and the notes rank equally with Sysco’s other unsecured senior debt.
- Net proceeds of approximately $1.24 billion will be used for general corporate purposes, including repayment of commercial paper borrowings.
- On February 10, 2026, Sysco entered into an Underwriting Agreement to issue $600 million 4.400% Senior Notes due 2031 and $650 million 4.950% Senior Notes due 2036, each fully guaranteed by its U.S. subsidiaries.
- The offering is expected to close on February 13, 2026, subject to customary closing conditions.
- The 2031 Notes are priced at 99.997% of par (yielding 4.401%) and the 2036 Notes at 99.637% of par (yielding 4.995%), with semi-annual interest payments.
- BofA Securities, Goldman Sachs, J.P. Morgan, TD Securities and Wells Fargo serve as joint book-running managers.
- Net sales rose 3% and adjusted EPS grew 6.5% in Q2; adjusted operating income was $807 million, adjusted EBITDA $1 billion (+3.3%), and free cash flow reached $413 million (+25% YTD).
- US local case volume increased 1.2%, while International sales grew 7.3% (local case +4.5%) and International adjusted operating income jumped 25.6%.
- Raised FY 2026 adjusted EPS guidance to the high end of $4.50–$4.60, with net sales growth of 3%–5% to $84–$85 billion and expected local case growth of at least 2.5% in Q3 and Q4.
- Expanded Northeast distribution via acquisition of Ginsberg’s Foods, adding capabilities accretive to Sysco’s portfolio.
- Recorded enterprise sales increase of 3% (3.5% ex-Mexico), $3.8 B gross profit (+3.9%) at 18.3% margin (+15 bps), $807 M Adjusted Operating Income and $1.0 B Adjusted EBITDA.
- Raised FY2026 Adjusted EPS guidance to the high end of $4.50–$4.60, targeting 5–7% growth excluding incentive compensation headwind.
- US Foodservice Local volume grew 1.2% (140 bps sequential improvement) and is expected to reach at least 2.5% growth in H2; International sales rose 7.3% (9.9% ex-Mexico) with Local case growth of 4.5% and Adjusted Operating Income growth near 26%.
- Completed the tuck-in acquisition of Ginsberg’s Foods in the Northeast to expand high-value regional scale, expected to contribute 50 bps to Local case growth in H2.
- Maintained a robust financial profile with $2.9 B liquidity, net debt leverage of 2.86x, and YTD free cash flow of $413 M (+25%).
- Sysco delivered nearly $21 billion in total revenue, up 3% YoY; adjusted EPS grew 6.5%, and free cash flow increased 25% YTD.
- US Foodservice local case volume rose 1.2%, marking a 140 bps sequential improvement, and Sysco expects at least 2.5% local case growth in both Q3 and Q4.
- The company now expects full-year adjusted EPS at the high end of its $4.50–$4.60 guidance range.
- International segment sales increased 7.3%, with 4.5% local case growth and 25.6% adjusted operating income growth.
- Completed acquisition of Ginsberg’s Foods to expand Northeast distribution, expected to add about 50 bps to local case growth in H2.
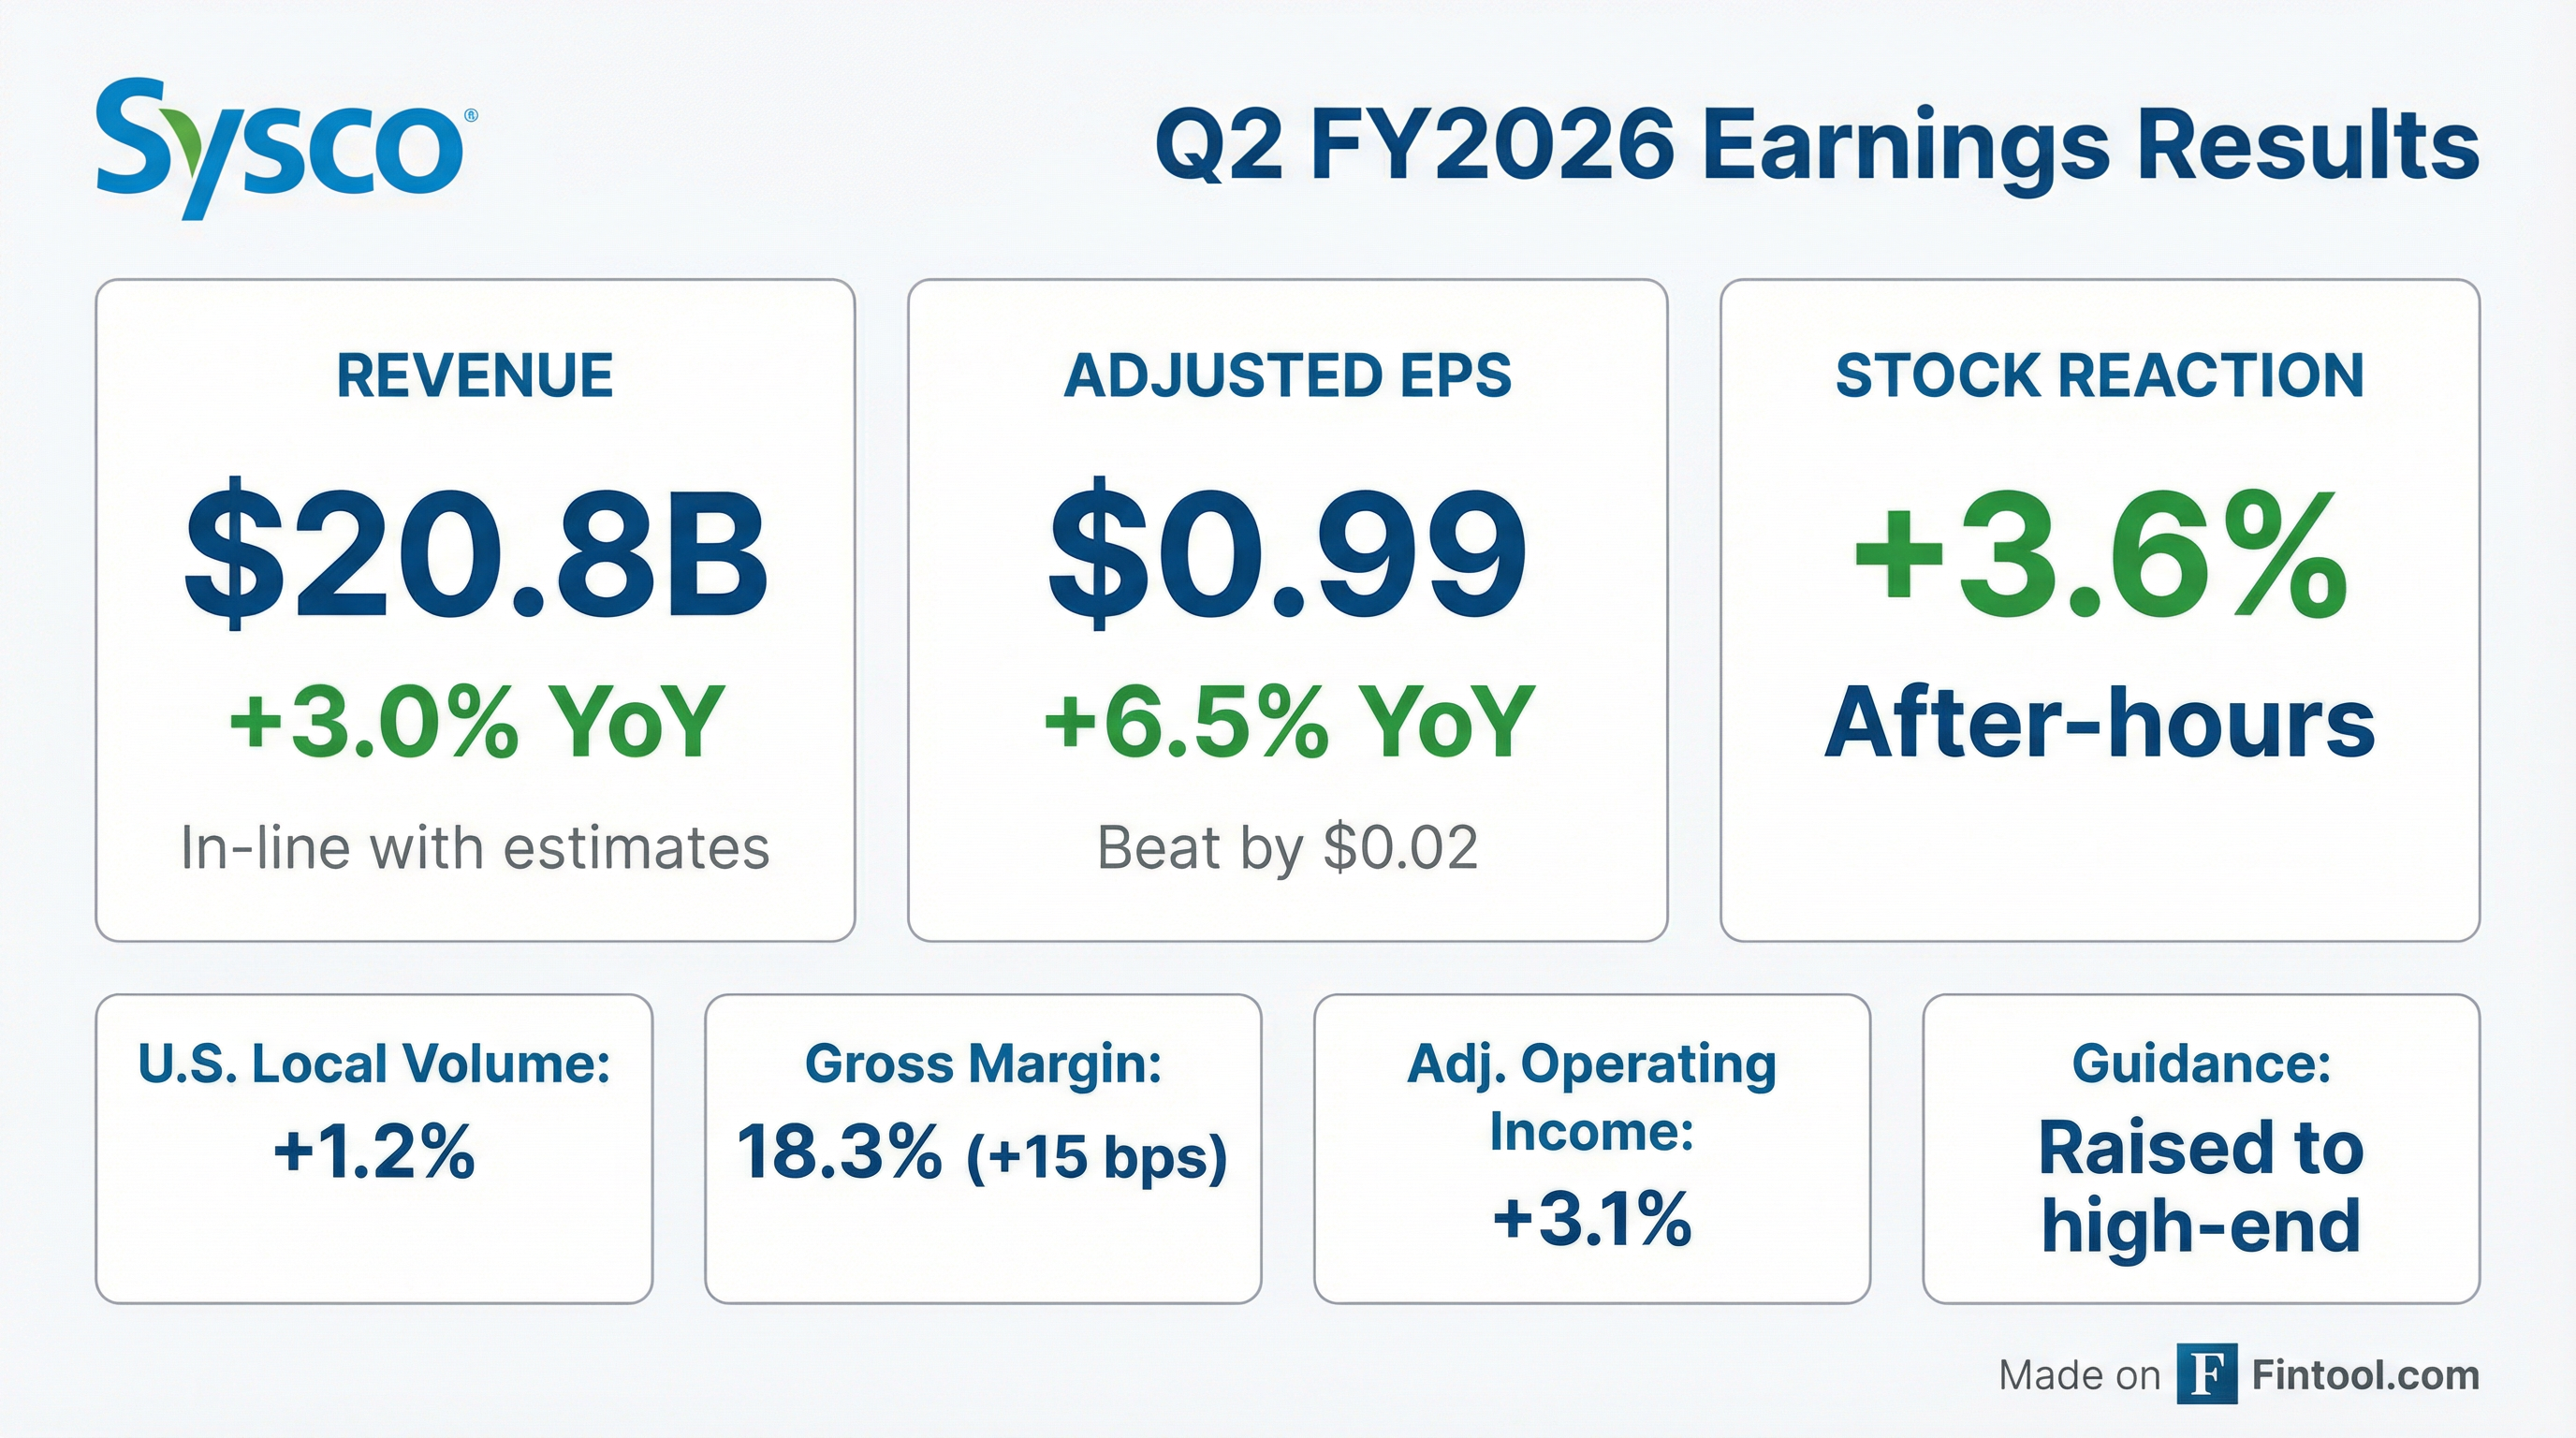
- Sysco delivered $20.8 B in net sales, up 3.0% YoY, with gross profit of $3.8 B (+3.9%), adjusted operating income of $807 M (+3.1%) and adjusted EPS of $0.99 (+6.5%).
- U.S. Foodservice sales rose 2.4% to $14.4 B, total case volume grew 0.8%, and local case volume improved 1.2% (up 140 bps sequentially).
- International segment sales increased 7.3% to $4.0 B (9.9% ex-Mexico JV), with adjusted operating income up 25.6% to $162 M; SYGMA sales edged +0.5% to $2.1 B, operating income $21 M.
- Strong liquidity: net debt of $12.4 B (2.86x Net Debt/EBITDA) and ~$2.9 B in total liquidity; returned $259 M to shareholders via dividends in Q2.
- Maintains FY26 adjusted EPS growth target of 5–7% (ex-$100 M incentive compensation headwind) and is targeting 2.5%+ local volume growth in 2H26.
Fintool News
In-depth analysis and coverage of SYSCO.

Quarterly earnings call transcripts for SYSCO.
Ask Fintool AI Agent
Get instant answers from SEC filings, earnings calls & more