Earnings summaries and quarterly performance for COMCAST.
Executive leadership at COMCAST.
Board of directors at COMCAST.
Asuka Nakahara
Director
David C. Novak
Director
Edward D. Breen
Lead Independent Director
Jeffrey A. Honickman
Director
Kenneth J. Bacon
Director
Louise F. Brady
Director
Madeline S. Bell
Director
Thomas J. Baltimore, Jr.
Director
Wonya Y. Lucas
Director
Research analysts who have asked questions during COMCAST earnings calls.
Craig Moffett
MoffettNathanson
9 questions for CMCSA
John Hodulik
UBS Group AG
9 questions for CMCSA
Michael Ng
Goldman Sachs
9 questions for CMCSA
Benjamin Swinburne
Morgan Stanley
7 questions for CMCSA
Jessica Reif Ehrlich
Bank of America Securities
5 questions for CMCSA
Michael Rollins
Citigroup
5 questions for CMCSA
Kutgun Maral
Evercore ISI
4 questions for CMCSA
Jonathan Chaplin
New Street Research
3 questions for CMCSA
Jessica Reif
Bank of America
2 questions for CMCSA
Jessica Reif Cohen
Bank of America Merrill Lynch
2 questions for CMCSA
Mike Rollins
Citigroup
2 questions for CMCSA
Steven Cahall
Wells Fargo & Company
2 questions for CMCSA
Recent press releases and 8-K filings for CMCSA.
- Comcast is simplifying cable pricing and accelerating a broadband transformation focused on network virtualization, DOCSIS 4.0 upgrades (60% mid-splits completed) toward full duplex (FDX), enhanced Wi-Fi and a revamped go-to-market to improve customer experience and defend against fiber and fixed-wireless competition .
- The MVNO added 1.5 million lines last year, reaching 9 million lines (15% household penetration); promotional “free” lines will roll to paid plans (≈ $25/month) to drive incremental revenue and higher ARPU .
- NBCUniversal’s streaming business hit 44 million Peacock subscribers and achieved a $700 million P&L improvement in 2025, with a target to reach profitability by 2027; Olympic coverage drove 17 billion streaming minutes and 85% of X1 households tuned in, lifting viewership by 76% over the national average ** **.
- Epic Universe in Orlando has exceeded attendance and per-cap expectations, boosting hotel stays and overall park margins; while international tourism remains pressured, domestic visitation remains robust and ride-capacity optimizations continue .
- Over the past five years Comcast returned $70 billion of capital, including $50 billion in share buybacks, and maintains a strong balance sheet with organic growth as the priority, while remaining open to value-accretive M&A .
- Comcast is simplifying its cable go-to-market with all-inclusive pricing and a revamped customer experience to counter fiber and fixed-wireless competition, while advancing its network to full-duplex DOCSIS 4.0 (mid-splits ~60% complete) to deliver symmetric multi-gigabit speeds and reduce repair calls.
- The Comcast MVNO added 1.5 million lines in 2025 to reach 9 million lines (15% household penetration), using free promotional lines that will convert to $25/month paying subscribers later in 2026 and targeting upsell with a new Premium Unlimited plan.
- Epic Universe in Orlando has driven double-digit revenue and profit growth across Florida parks, boosting attendance, per-cap spending and hotel stays, with further ride-flow capacity enhancements underway despite ongoing softness in international visitation.
- In media, NBC Sports’ first NBA season under its new 11-year deal lifted ratings 15%, including the most-watched All-Star Game in 15 years, while Peacock reached 44 million subscribers and delivered $700 million of P&L improvement in 2025, positioning it for domestic profitability by 2027.
- Comcast showcased its tech and marketing prowess with 17 billion minutes streamed on Peacock during February events—Super Bowl, Olympics and NBA—with 4K real-time streaming and 85% X1 household participation, generating 9 billion promotional impressions and 52% of Peacock consumption on entertainment content.
- The broadband segment features a gig-plus capable network, 60% completion of DOCSIS 4.0 mid-splits en route to full FDX, and a simplified, transparent go-to-market to combat fixed-wireless and fiber competition.
- Wireless MVNO growth reached 9 million lines (1.5 million net adds in 2025), using free-line promotions expected to roll to $25 pay plans later this year, with 30% of new lines as add-Ons and a new Premium Unlimited tier for high-end customers.
- Peacock reached 44 million subscribers (adding 3 million in Q4), achieved $700 million in P&L improvements, and is targeting profitability by 2027 while leveraging NBC broadcast, sports rights and Universal content domestically.
- Comcast has returned $70 billion of capital over five years ($50 billion in buybacks), maintains a strong balance sheet and prioritizes organic growth over M&A.
- Versant reported $6.69 billion in full-year 2025 revenue (down ~5% YoY), with platforms revenue up 3.9% to $826 million.
- Adjusted EBITDA declined ~14% to $2.18 billion, sustaining margins above 30%.
- Net income was $930 million, a 31.8% decrease from 2024.
- The board authorized $1 billion in share repurchases and declared a $0.375 quarterly dividend per share, payable April 22, 2026.
- Management will redirect cash flow towards direct-to-consumer offerings, expanded sports rights and FAST services amid legacy pay-TV headwinds.
- Comcast lost 181,000 broadband subscribers in Q4 2025, froze broadband prices and rolled out simplified pricing with five-year locks and bundles to counter fiber and fixed-wireless competition.
- Broadband ARPU was $73.08 (up ~1.1% YoY) but is being diluted by promotions, with further downward pressure expected.
- Added 364,000 mobile lines in the quarter, bringing total to 9.3 million, and mobile revenue increased from $1.19 billion to $1.40 billion.
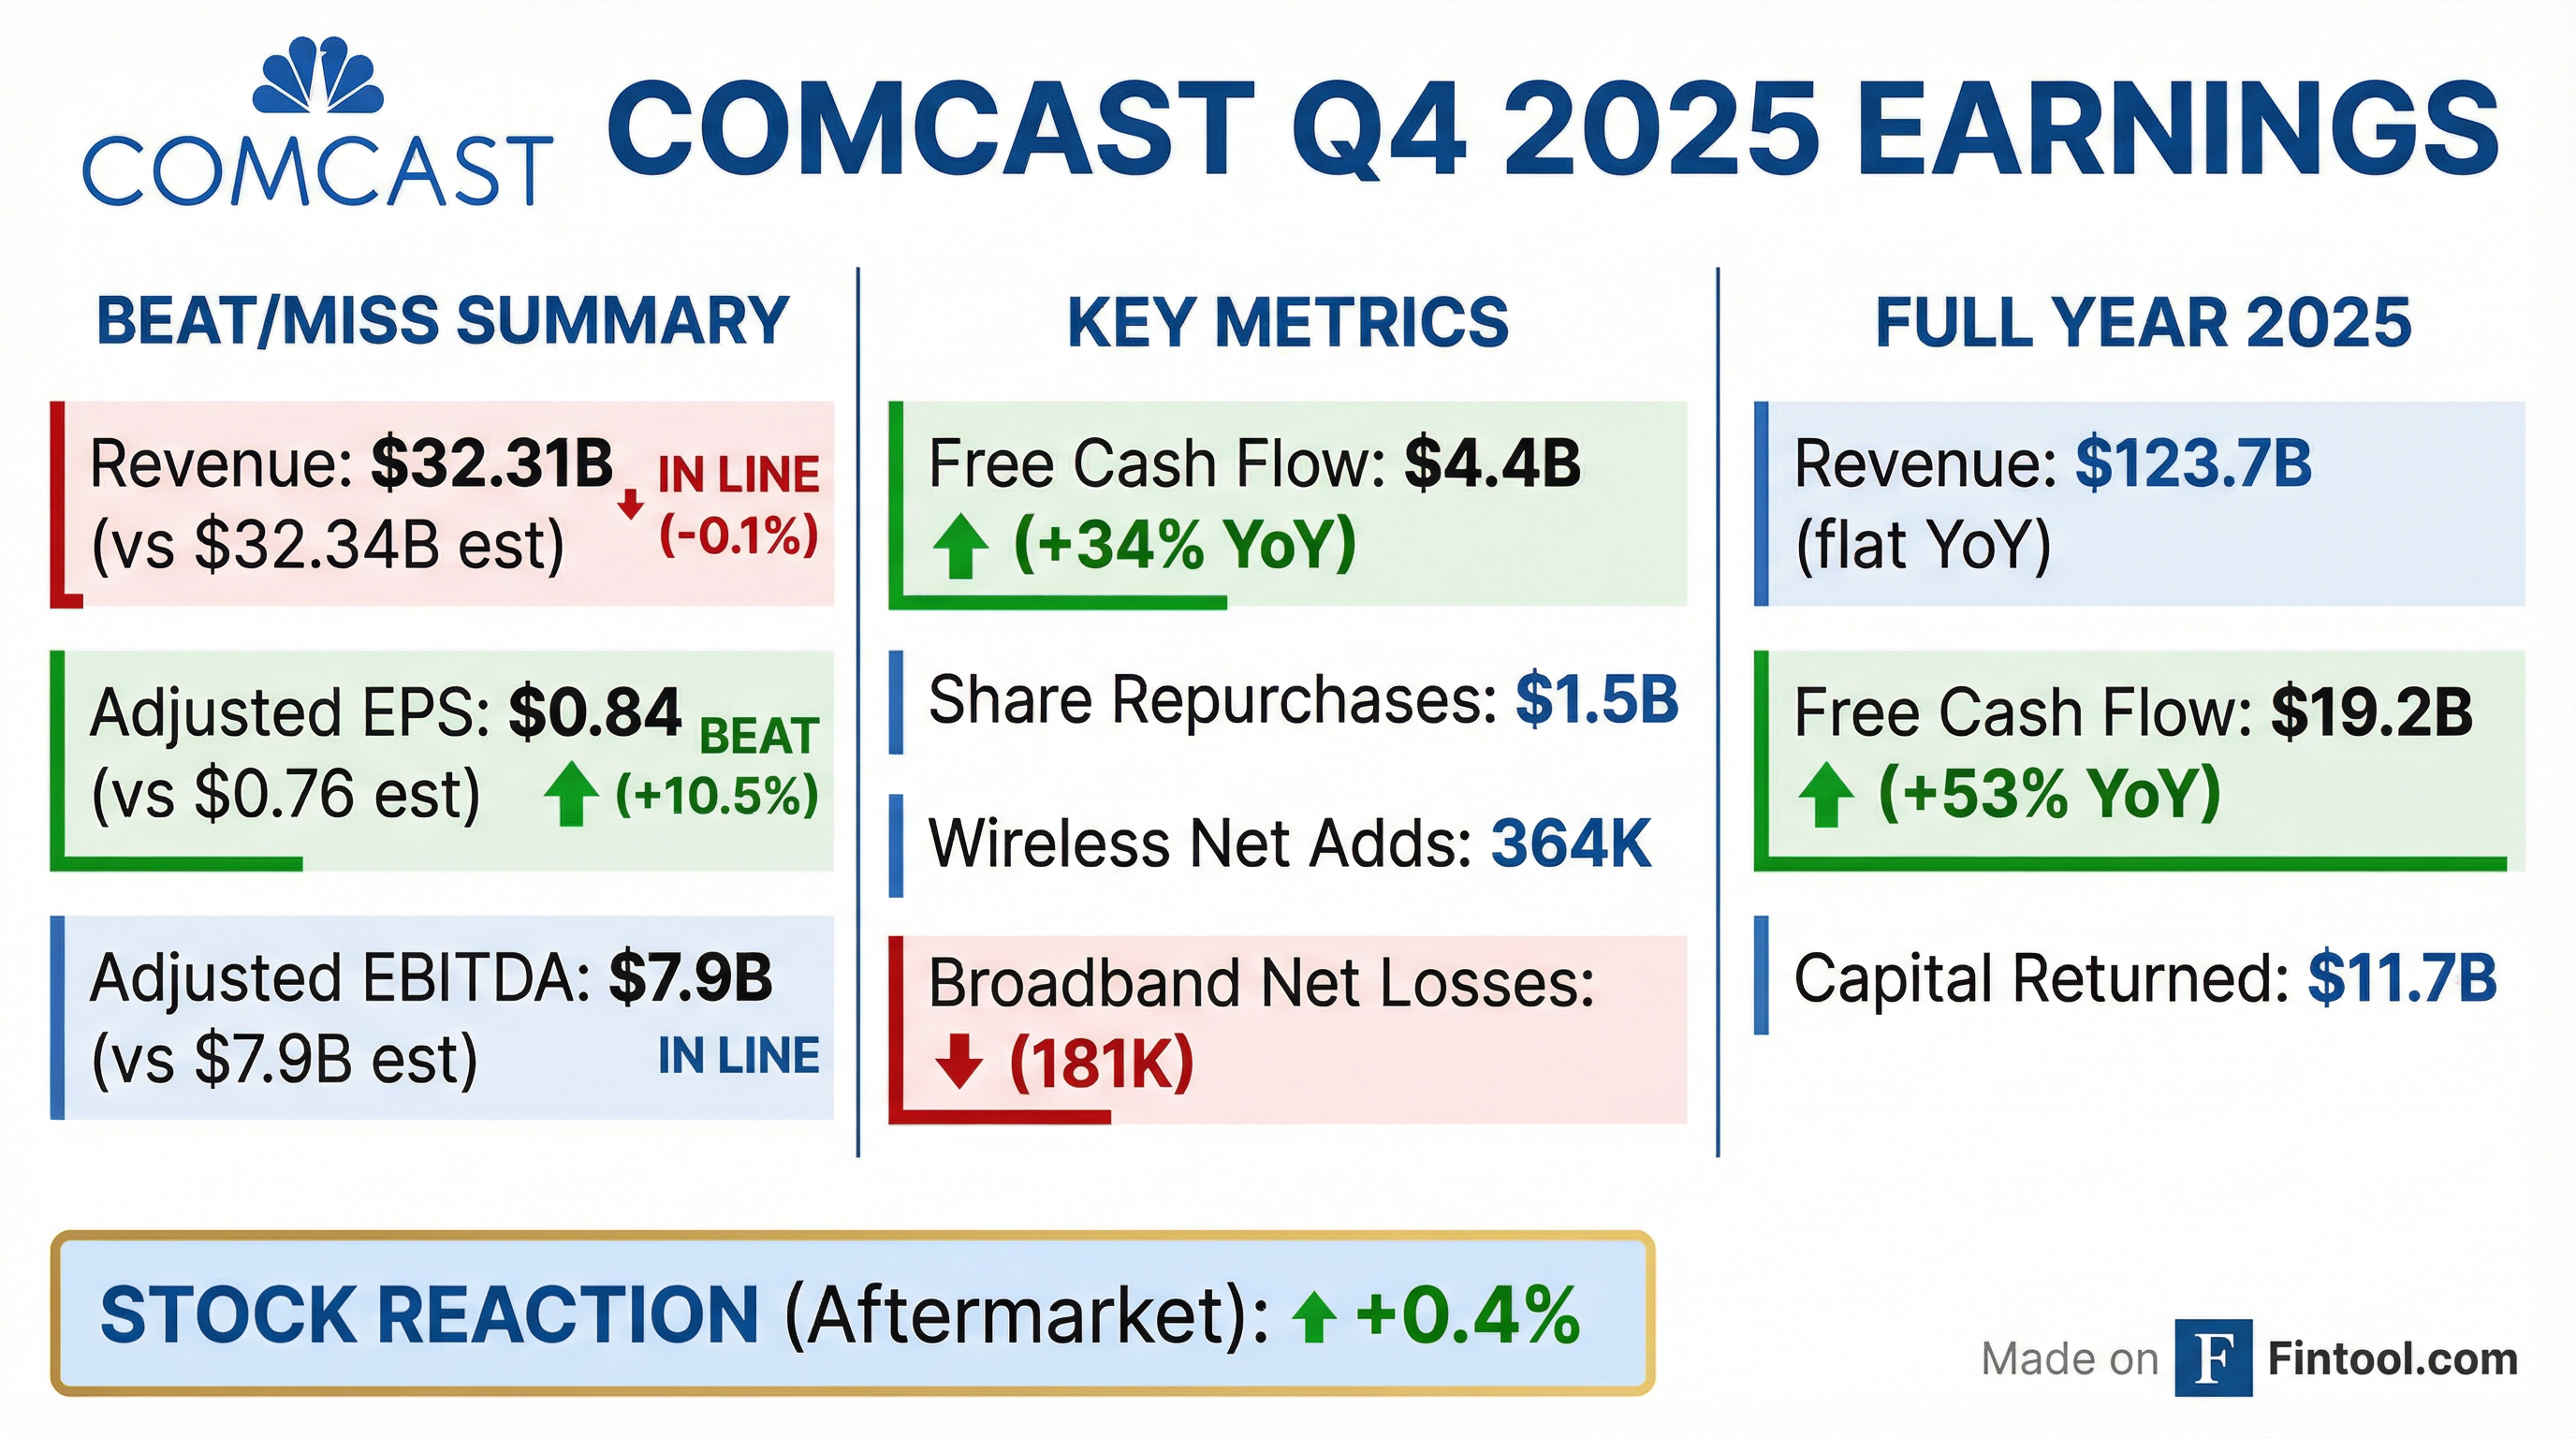
- Q4 revenue reached $32.31 billion, adjusted EPS was $0.84 (vs. $0.75 consensus), and free cash flow was $4.37 billion (above the $2.23 billion forecast).
- Peacock’s quarterly revenue grew 23% YoY to $1.6 billion, with its subscriber base rising to about 44 million.
- Total revenue grew 1%, Adjusted EBITDA declined 10%, Adjusted EPS declined 12%, and Free Cash Flow was $4.4 billion including a $2 billion tax benefit.
- In Connectivity & Platforms, broadband net losses were 181 k with ARPU up 1.1%, EBITDA down 4.5%; wireless added 364 k lines to total over 9 million (15% broadband penetration), and convergence revenue rose 2%.
- Theme Parks revenue increased 22% and EBITDA rose 24%, surpassing $1 billion EBITDA in a quarter for the first time, driven by Epic Universe attendance and per-cap spending.
- CapEx for 2025 was $14.4 billion (–5%), with $10.5 billion in connectivity & platforms and $3.6 billion in content & experiences; 2026 CapEx is expected to remain similar.
- Ended 2025 with net leverage at 2.3×, maintained the dividend at $1.32 per share (18th consecutive annual increase), and returned $2.7 billion to shareholders in the quarter, including $1.5 billion in share repurchases.
- Total company revenue grew 1% in Q4, while adjusted EBITDA declined 10% and adjusted EPS fell 12%; Q4 free cash flow was $4.4 B including a $2 B tax benefit
- Connectivity & Platforms saw broadband net losses of 181 k customers with ARPU up 1.1%; segment EBITDA fell 4.5%; wireless added 364 k lines, totaling 9 M lines (≈15% broadband penetration)
- Business Services revenue rose 6% and EBITDA 3%; Theme Parks revenue +22%, EBITDA +24% (Q4 parks EBITDA exceeded $1 B); Media revenue increased 6%, driven by Peacock growth
- Capital returned: $12 B to shareholders in 2025 including $7 B of share repurchases; dividend maintained at $1.32/share; completed Versant Media spin-off on Jan 2, 2026
- Revenue +1% in Q4, with theme parks, Peacock, and domestic wireless each delivering ~20% growth.
- Adjusted EBITDA –10% and EPS –12%; generated $4.4 B free cash flow (including $2 B tax benefit); returned $2.7 B to shareholders (incl. $1.5 B in buybacks).
- Connectivity segment saw 181k broadband net losses and ARPU +1.1%; convergence revenue +2% driven by 364k wireless adds, ~50% on free lines.
- Peacock revenue +>20% to $1.6 B, paid subs reached 44 M; Q4 losses of $552 M; full-year Peacock losses improved by >$700 M YoY.
- Full-year FCF of $19.2 B (record); 2025 capex $14.4 B; net leverage 2.3x; 2026 capex expected similar; dividend maintained at $1.32/sh.
- Comcast reported Q4 2025 revenue of $32.3 billion (vs. $31.9 billion in Q4 2024), Adjusted EBITDA of $7.9 billion (vs. $8.8 billion), and Adj. EPS of $0.84 (vs. $0.96); FY 2025 revenue was $123.7 billion (flat y/y), Adjusted EBITDA $37.4 billion, and Adj. EPS $4.31.
- Free Cash Flow was $4.4 billion in Q4 and $19.2 billion for FY 2025; returned $11.7 billion to shareholders via $6.8 billion in share repurchases and $4.9 billion in dividends.
- Connectivity & Platforms: Q4 residential revenue down 3.1% to $17.646 billion, domestic wireless revenue up 18%, 364 K wireless lines added in Q4; Business Services revenue up 5.8% to $2.59 billion.
- Content & Experiences: Theme Parks revenue up 21.9% to $2.893 billion, Studios revenue down 7.4% to $3.027 billion, Media revenue up 5.5% to $7.62 billion; Peacock revenue grew 23% to $1.6 billion with 44 million subscribers (+22%).
- Revenue of $32.31 B in Q4 (+1.2% YoY) and $123.707 B for FY (flat), with net income of $2.168 B in Q4 (–54.6%) and $19.998 B for FY (+23.5%).
- Adjusted EBITDA of $7.9 B in Q4 (–10.3%) and $37.384 B for FY (–1.8%).
- Free cash flow of $4.369 B in Q4 (+34%) and $19.235 B for FY (+53.4%); returned $2.7 B to shareholders in Q4 and $11.7 B for the full year.
- Achieved record 1.5 M wireless net line additions in 2025, totaling over 9 M lines and surpassing 15% broadband penetration.
- Completed tax-free separation of Versant Media on January 2, 2026 (1 share Versant per 25 Comcast).


Quarterly earnings call transcripts for COMCAST.
Ask Fintool AI Agent
Get instant answers from SEC filings, earnings calls & more