Earnings summaries and quarterly performance for FMC.
Executive leadership at FMC.
Pierre Brondeau
Chief Executive Officer
Andrew Sandifer
Executive Vice President and Chief Financial Officer
Brian Angeli
Executive Vice President and Chief Marketing Officer
Jacqueline Scanlan
Executive Vice President and Chief Human Resources Officer
Ronaldo Pereira
President
Sara Velazquez Ponessa
Executive Vice President, General Counsel and Corporate Secretary
Seva Rostovtsev
Executive Vice President and Chief Technology Officer
Thaisa Hugenneyer
Executive Vice President, Integrated Supply Chain
Board of directors at FMC.
Anthony DiSilvestro
Director
Dirk Kempthorne
Director
Eduardo Cordeiro
Director
John Davidson
Director
John Raines
Director
K'Lynne Johnson
Director
Kathy Fortmann
Director
Margareth Ovrum
Director
Patricia Verduin
Director
Robert Pallash
Director
Scott Greer
Lead Independent Director
Steven Merkt
Director
Research analysts who have asked questions during FMC earnings calls.
Vincent Andrews
Morgan Stanley
6 questions for FMC
Aleksey Yefremov
KeyBanc Capital Markets
5 questions for FMC
Frank Mitsch
Fermium Research
5 questions for FMC
Joel Jackson
BMO Capital Markets
5 questions for FMC
Christopher Parkinson
Wolfe Research
4 questions for FMC
Edlain Rodriguez
Mizuho Securities
3 questions for FMC
Kevin McCarthy
Vertical Research Partners
3 questions for FMC
Mike Harrison
Seaport Research Partners
3 questions for FMC
Alex Amarant
UBS
2 questions for FMC
Arun Viswanathan
RBC Capital Markets
2 questions for FMC
Benjamin Theurer
Barclays Corporate & Investment Bank
2 questions for FMC
Harris Fein
Wolfe Research
2 questions for FMC
Josh Spector
UBS Group
2 questions for FMC
Joshua Spector
UBS
2 questions for FMC
Laurence Alexander
Jefferies
2 questions for FMC
Matt De Yoe
Bank of America
2 questions for FMC
Matt Hutworth
Vertical Research Partners
2 questions for FMC
Patrick Cunningham
Citigroup
2 questions for FMC
Richard Garchitorena
Wells Fargo
2 questions for FMC
Steve Byrne
Bank of America
2 questions for FMC
Duffy Fischer
Goldman Sachs
1 question for FMC
Jeffrey Zekauskas
JPMorgan Chase & Co.
1 question for FMC
Laurent Favre
BNP Paribas
1 question for FMC
Michael Harrison
Seaport Research Partners
1 question for FMC
Recent press releases and 8-K filings for FMC.
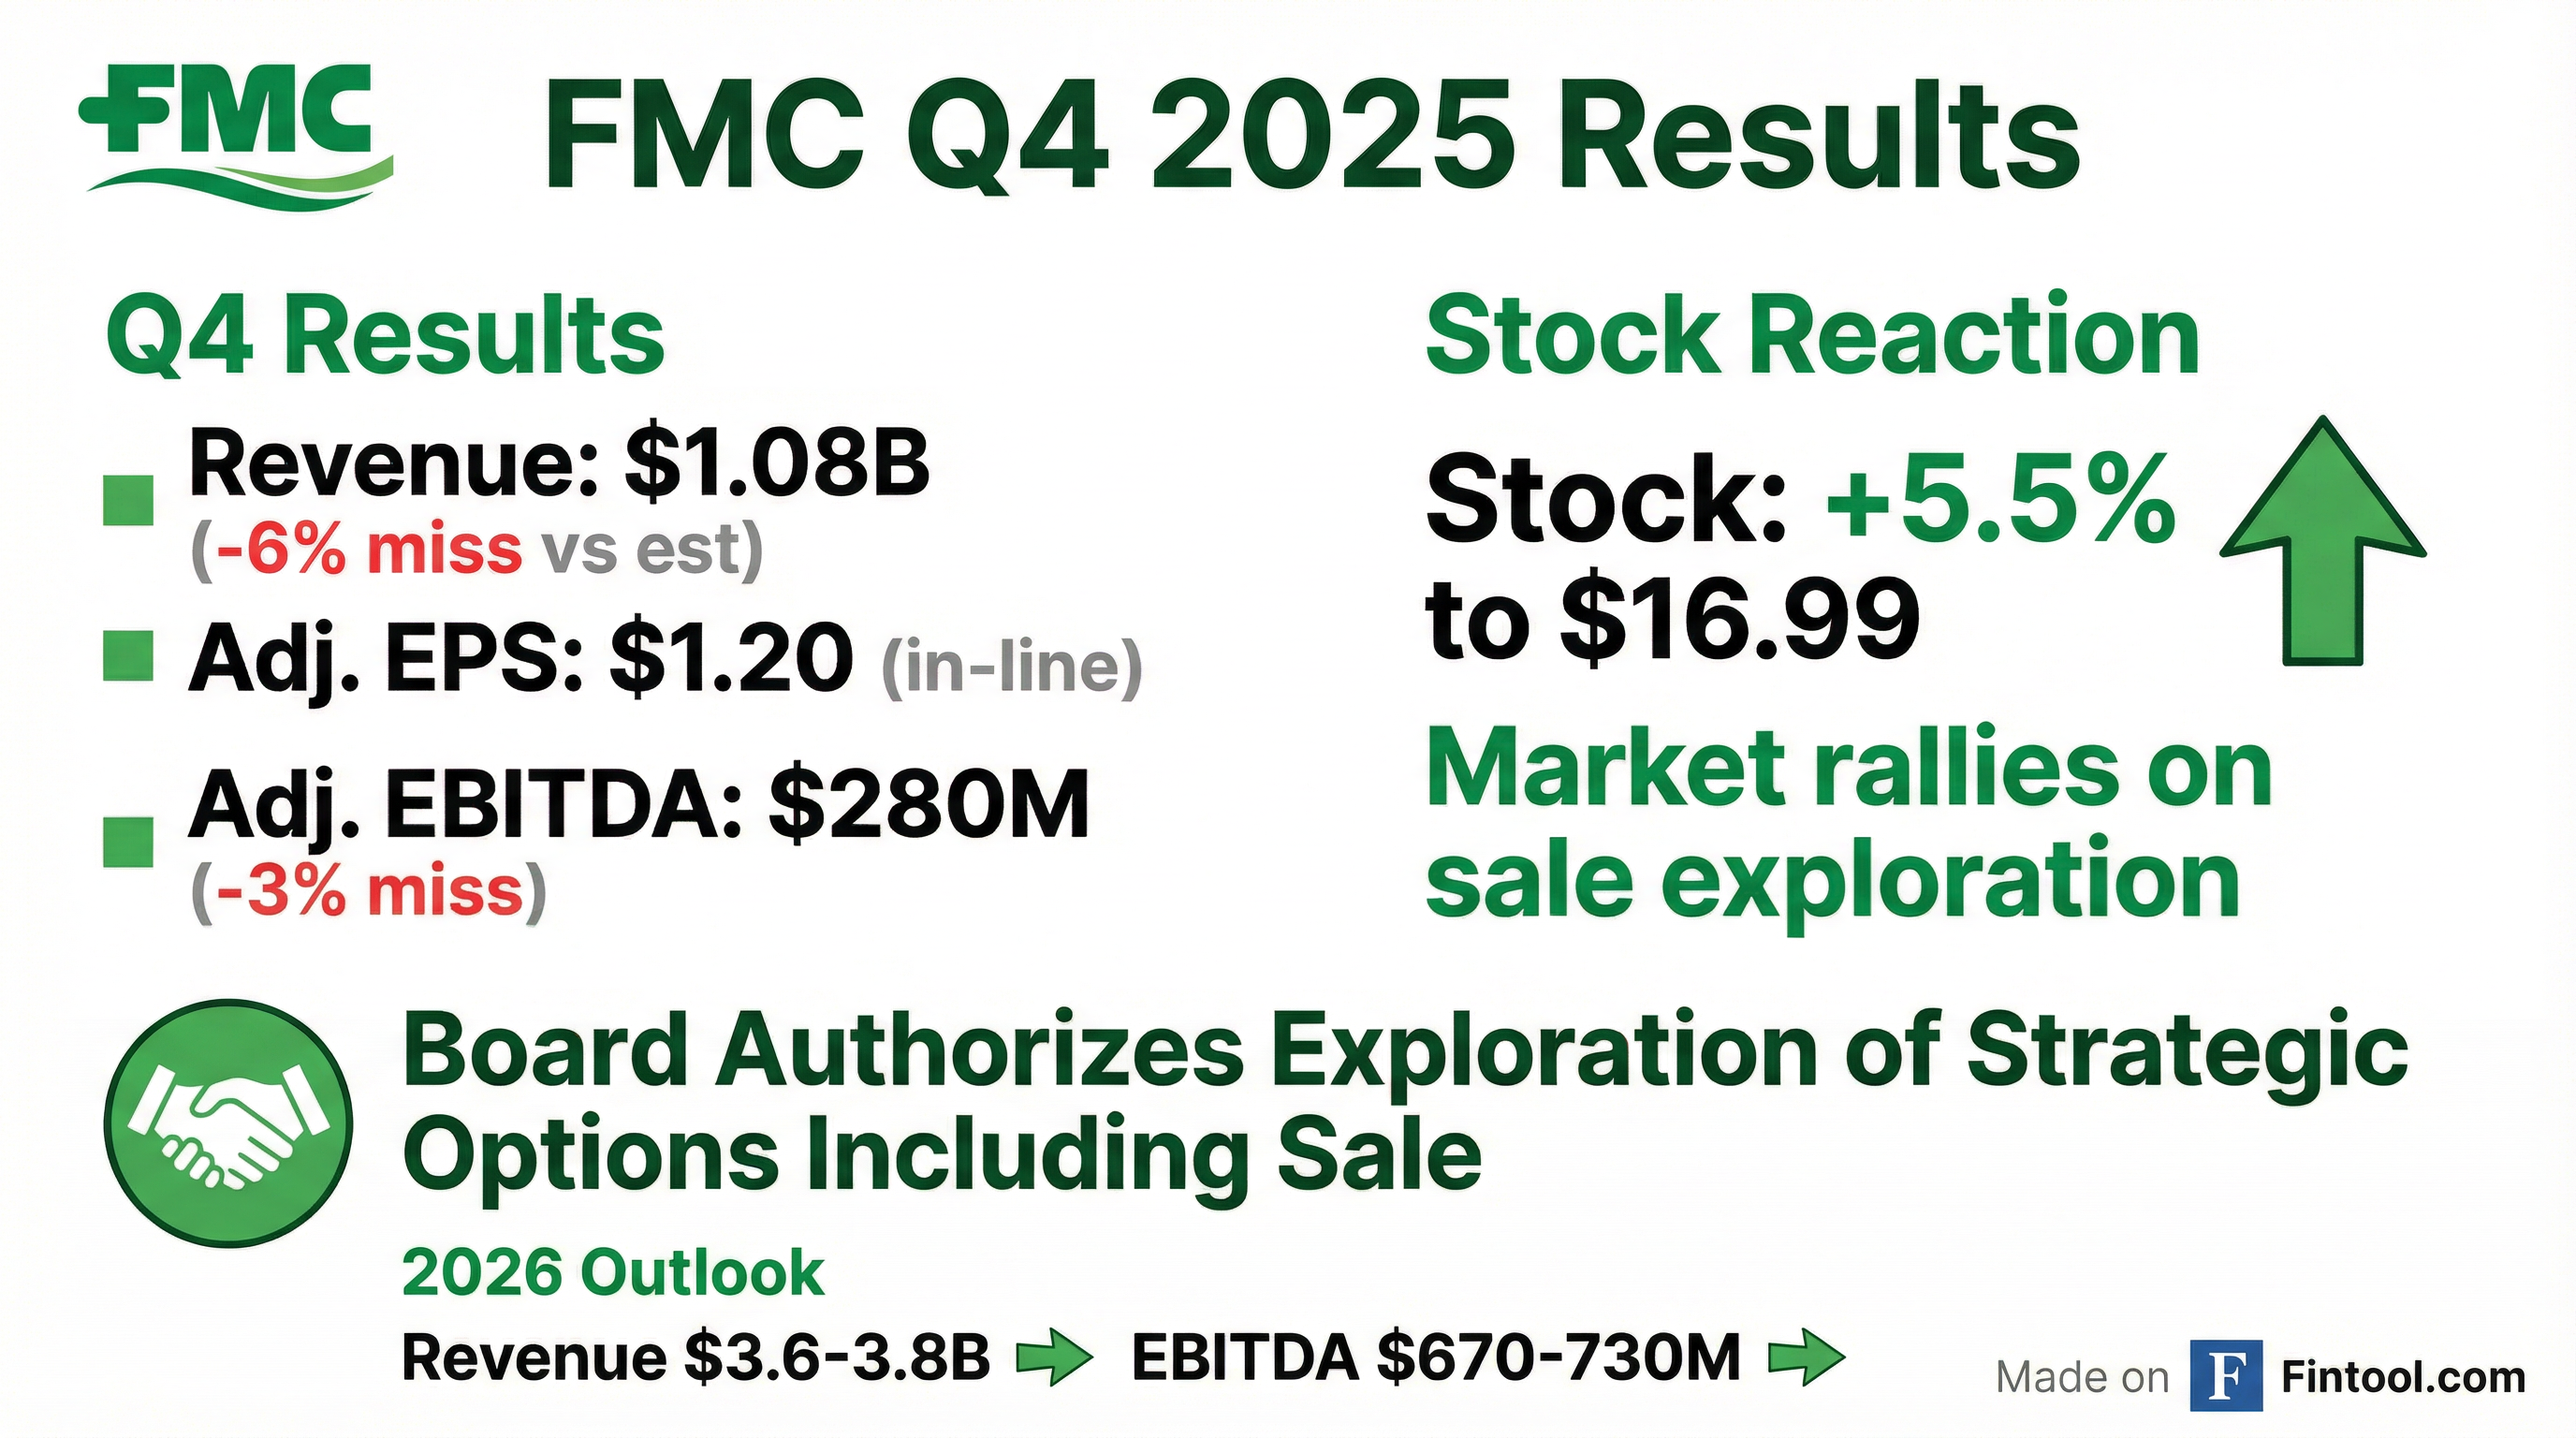
- Board-authorized strategic review to explore options including a potential sale; base plan targets $1 billion of debt reduction via the India commercial business sale and licensing agreements; process at preliminary stage with financial and legal advisors retained.
- Q4 2025 results: $1.08 billion in sales (–11% YoY; –5% ex-India), $280 million adjusted EBITDA (–17% YoY; –8% ex-India), $1.20 adjusted EPS (–33% YoY); free cash flow $623 million in the quarter; FY 2025 free cash flow –$165 million; net debt $3.5 billion, leverage 4.1× EBITDA.
- 2026 guidance: full-year sales $3.6–3.8 billion (–5% vs 2025) and adjusted EBITDA $670–730 million; Q1 sales $725–775 million, adjusted EBITDA $45–50 million; free cash flow expected to be roughly break-even (–$65 million to +$65 million) including $130 million of restructuring spend, targeting ~0.5× net leverage reduction.
- 2026 operational priorities: strengthen the balance sheet; improve legacy portfolio competitiveness by cutting non-diamide manufacturing costs 35% by 2027; manage post-patent Rynaxypyr strategy (2025 sales ~$800 million); and accelerate new active ingredients—sales up 54% to ~$200 million in 2025, with targets of $300–400 million in 2026 and $2 billion by 2035.
- Board has authorized a preliminary strategic review, including a potential sale of the entire company and separate processes to divest the India commercial business and pursue licensing deals, to maximize shareholder value.
- Q4 2025 sales were $1.08 billion, down 11% Y/Y (-5% ex-India); adjusted EBITDA was $280 million, down 17% Y/Y (-8% ex-India); adjusted EPS was $1.20, down 33% Y/Y.
- 2026 guidance: full-year sales of $3.6–$3.8 billion (-5% at midpoint), adjusted EBITDA of $670–$730 million; Q1 sales of $725–$775 million and Q1 adjusted EBITDA of $45–$50 million.
- Year-end 2025 net debt was $3.5 billion (4.1× trailing EBITDA); Q4 free cash flow was $623 million, full-year 2025 free cash flow was –$165 million. 2026 free cash flow is expected to be –$65 million to +$65 million (break-even at midpoint) supporting a $1 billion debt-reduction plan.
- FMC reported Q4 sales of $1.08 billion (−11% y/y; −5% ex-India), adjusted EBITDA of $280 million (−17% y/y; −8% ex-India), and adj. EPS of $1.20 (−33% y/y). Q4 free cash flow was $623 million, ending the period with net debt of $3.5 billion (4.1× TTM EBITDA).
- The board has authorized a preliminary review of strategic options, including a potential sale of the company, while continuing the sale of the India commercial business. FMC aims to pay down >$1 billion of debt via asset sales and licensing agreements in 2026 ; it guides 2026 sales of $3.6–3.8 billion and adj. EBITDA of $670–730 million.
- Operational priorities for 2026 include strengthening the balance sheet, improving core portfolio competitiveness (lowering manufacturing costs by ≥35% by 2027), executing a post-patent Rynaxypyr strategy (2025 sales ~$800 million, branded earnings flat in 2026), and growing four new active ingredients (2025 sales ~$200 million, +54% y/y; expected $300–400 million in 2026; >$2 billion by 2035).
- For 2026, FMC expects free cash flow of –$65 million to +$65 million (break-even at midpoint, including $130 million in restructuring spend) and projects net leverage to decline by ~0.5× by year-end.
- Q4 2025 revenue ex-India was $1,086 million, down on lower volumes, pricing and FX headwinds.
- Adjusted EBITDA declined 17% YoY to $280 million, driven by volume and price pressures partly offset by cost savings and favorable FX.
- FY 2026 guidance: $3.60–3.80 billion revenue (–5% YoY), $670–730 million adjusted EBITDA (–17%), $1.63–1.89 adjusted EPS (–41%).
- 2026 strategic priorities include strengthening the balance sheet with $1 billion debt paydown via asset sales (including India), licensing deals and core portfolio competitiveness improvements.
- The Board has authorized exploration of strategic options, including a potential sale, to unlock shareholder value and position its core portfolios for long-term success.
- Q4 2025 revenue was $1.08 billion, down 12% YoY; Adjusted EBITDA was $280 million, down 17%, and Adjusted EPS was $1.20, a 33% decline.
- Full-year 2025 revenue totaled $3.47 billion, down 18%, with Adjusted EBITDA of $843 million (-7%) and Adjusted EPS of $2.96 (-15%).
- 2026 outlook includes revenue guidance of $3.60–$3.80 billion (-5%), Adjusted EBITDA of $670–$730 million, and Adjusted EPS of $1.63–$1.89.
- The FMC Board has authorized the exploration of strategic options, including a potential sale of the company, to unlock shareholder value and position its assets and pipeline for long-term success.
- FMC’s 2026 operational priorities include strengthening the balance sheet by paying down $1 billion of debt (including the sale of its India commercial business), improving core portfolio competitiveness, managing the post-patent Rynaxypyr® transition and accelerating commercialization of new active ingredients (Isoflex®, fluindapyr, Dodhylex® and rimisoxafen).
- Full-year 2026 guidance calls for $3.60 billion to $3.80 billion of revenue (down 5% at midpoint), $670 million to $730 million of Adjusted EBITDA (down 17% at midpoint) and $1.63 to $1.89 of Adjusted EPS (down 41% at midpoint).
- Q4 2025 revenue was $1.08 billion (-12% YoY) , and full-year 2025 revenue was $3.47 billion (-18% YoY).
- FMC’s Board approved Project Foundation, including a Manufacturing Restructuring Program to optimize its cost structure and exit high-cost plants, targeting $175 million of annual run-rate savings by end of 2027.
- The company expects $560–635 million of pre-tax restructuring charges, of which $420–440 million are non-cash asset write-offs and $140–195 million are cash expenditures for severance, consulting and decommissioning.
- Following a steep stock-price decline, FMC will test goodwill and other intangible assets for impairment and anticipates a significant non-cash impairment charge that will not affect cash flows.
- FMC will take an aggressive approach to its balance sheet in 2026, targeting significant value from $2 billion of working capital, proceeds from the India business sale and portfolio/licensing options to accelerate debt reduction.
- Management expects 2026 to be a deep transformation year with headwinds from deflationary pricing and tariffs, setting the stage for an EBITDA jump in 2027 as cost cuts and streamlined operations take effect.
- By 2028, FMC forecasts its four new molecules to reach approximately $1 billion in annual revenue, shifting the portfolio toward faster-growing, IP-protected products.
- The company aims to keep dollar earnings of its growth portfolio flat from 2025 through 2028 by leveraging premium formulations and agronomic support to offset generic price erosion on key products like Rynaxypyr.
- In 2026, FMC will undergo a deep transformation with a focus on aggressive balance-sheet actions, extracting value from $2 billion of working capital and exploring portfolio monetization to reduce leverage.
- The $2.5 billion core crop-protection portfolio has seen share losses against generics, prompting a complete supply-chain and cost reengineering to restore competitiveness.
- FMC expects its four new growth molecules to reach $2 billion–$2.5 billion in combined revenue by 2028, with three products commercial by 2027 and the fourth (Rimisoxafen) launching thereafter.
- The Rynaxypyr active ingredient faces 10–30% price declines but FMC plans to offset this through premium formulations, agronomic services, and COGS reductions.
- A leaner balance sheet and executed cost initiatives are projected to deliver a notable EBITDA uplift in 2027.
- Aggressive balance sheet review: FMC plans to extract value from $2 billion of working capital, potential sale of India assets, dividend adjustments, portfolio licensing, and strategic partnerships to reduce leverage.
- Core Crop Protection headwinds: The $2.5 billion core crop products business has experienced share losses and margin pressure from generic competition and deflationary pricing, prompting supply chain and manufacturing cost overhauls.
- 2026–2028 transformation outlook: 2026 will be a deep restructuring year with headwinds (pricing, tariffs, India), followed by an expected EBITDA rebound in 2027; by 2028, four new growth molecules are projected to generate close to $1 billion annually.
- Product strategy: Rynaxypyr pricing is expected to decline by up to 30%, but volume growth, cost reductions, premium formulations, and agronomic support aim to maintain flat dollar earnings; Cyazypyr remains protected through 2029 with ongoing cost optimization.
Fintool News
In-depth analysis and coverage of FMC.

Quarterly earnings call transcripts for FMC.
Ask Fintool AI Agent
Get instant answers from SEC filings, earnings calls & more