Earnings summaries and quarterly performance for WEX.
Executive leadership at WEX.
Melissa Smith
Chief Executive Officer and President
Ann Drew
Chief Risk and Compliance Officer
Carlos Carriedo
Chief Operating Officer, Americas Payments & Mobility
Jagtar Narula
Chief Financial Officer
Jay Dearborn
Chief Operating Officer, International
Jennifer Kimball
Chief Accounting Officer
Karen Stroup
Chief Digital Officer
Robert Deshaies
Chief Operating Officer, Benefits
Sachin Dhawan
Chief Technology Officer
Sara Trickett
Chief Legal Officer, Interim Chief People Officer, and Corporate Secretary
Board of directors at WEX.
Aimee Cardwell
Director
Daniel Callahan
Director
David Foss
Director
Derrick Roman
Director
Jack VanWoerkom
Vice Chairman and Lead Director
James Groch
Director
James Neary
Director
Nancy Altobello
Director
Shikhar Ghosh
Director
Stephen Smith
Director
Susan Sobbott
Director
Research analysts who have asked questions during WEX earnings calls.
David Koning
Robert W. Baird & Co.
9 questions for WEX
Sanjay Sakhrani
Keefe, Bruyette & Woods (KBW)
9 questions for WEX
Mihir Bhatia
Bank of America
6 questions for WEX
Rayna Kumar
Oppenheimer & Co. Inc.
6 questions for WEX
Darrin Peller
Wolfe Research, LLC
5 questions for WEX
Ramsey El-Assal
Barclays
5 questions for WEX
Andrew Jeffrey
William Blair & Company
4 questions for WEX
Nate Svensson
Deutsche Bank
4 questions for WEX
Trevor Williams
Jefferies LLC
4 questions for WEX
Andrew Bauch
Wells Fargo & Company
3 questions for WEX
Dan Dolev
Mizuho Financial Group
2 questions for WEX
Michael Infante
Morgan Stanley
2 questions for WEX
Michael Rosenthal
Morgan Stanley
2 questions for WEX
Nate Sanson
Deutsche Bank
2 questions for WEX
Nik Cremo
UBS Group AG
2 questions for WEX
Nikolai Cremo
UBS
2 questions for WEX
Shray Gurtata
Barclays
2 questions for WEX
Tien-tsin Huang
JPMorgan Chase & Co.
2 questions for WEX
Christopher Svensson
Deutsche Bank AG
1 question for WEX
Daniel Krebs
Wolfe Research
1 question for WEX
John Davis
Raymond James Financial
1 question for WEX
Recent press releases and 8-K filings for WEX.
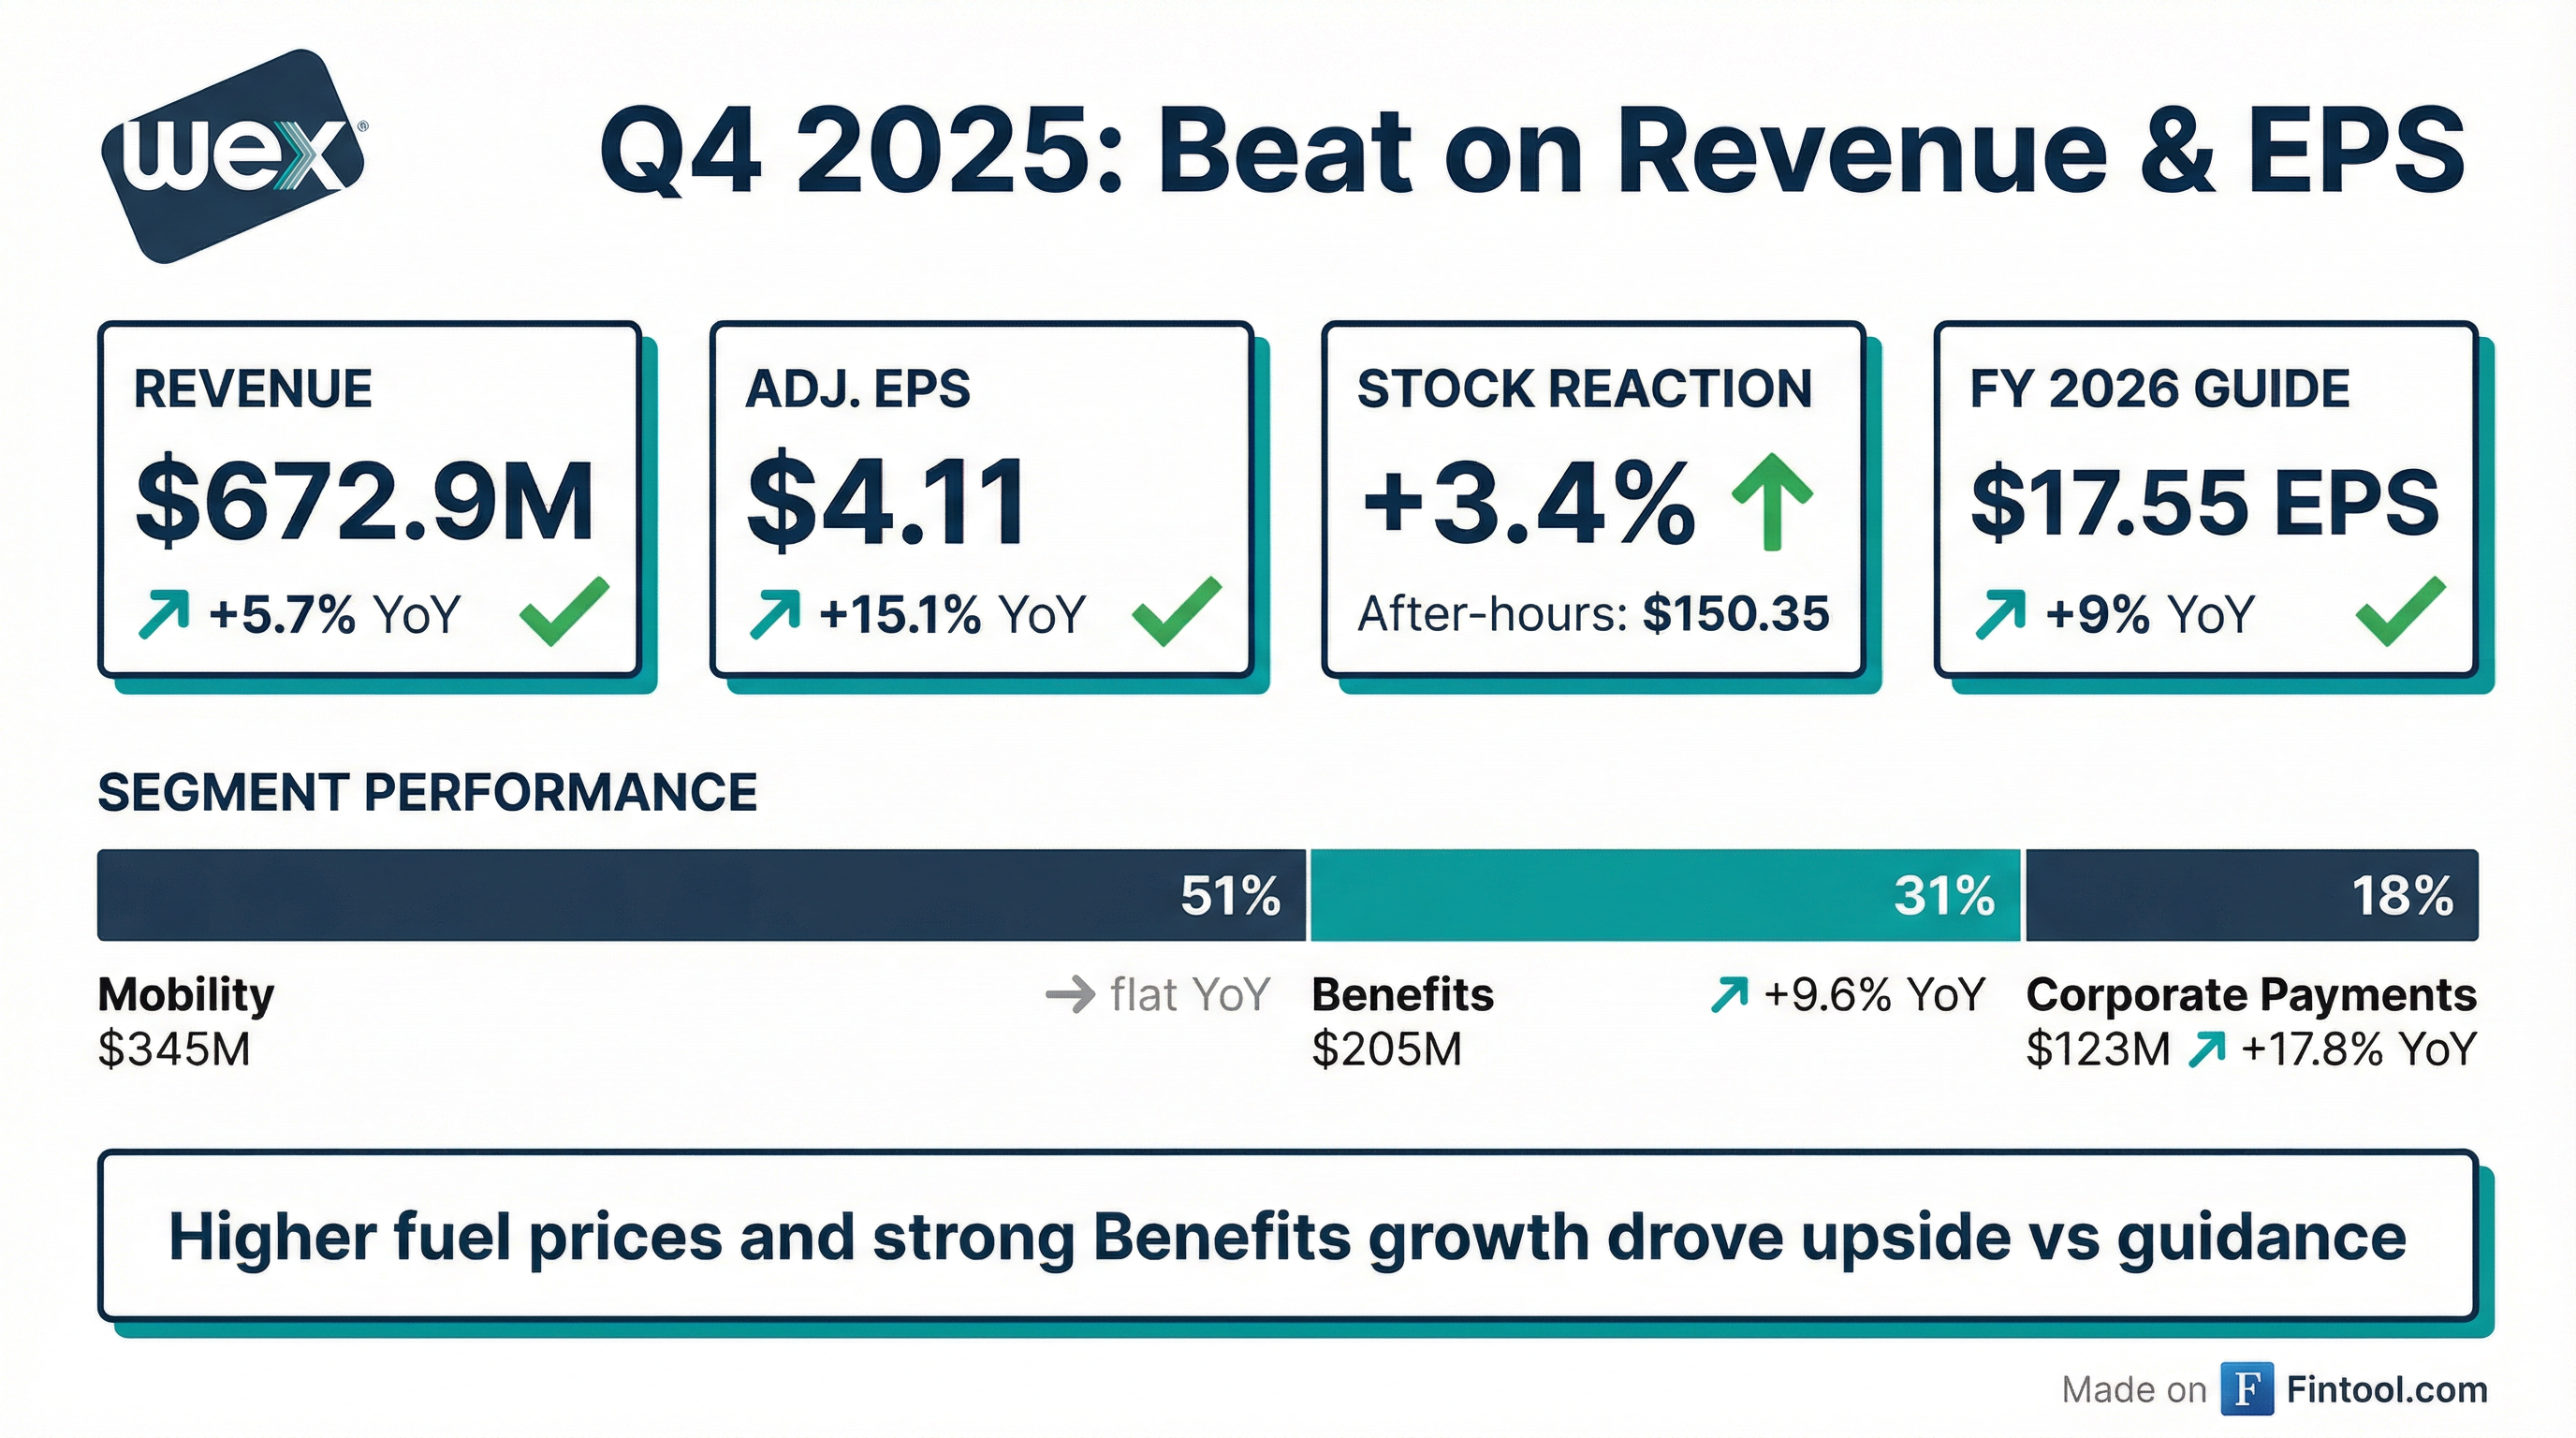
- WEX reported Q4 2025 revenue of $672.9 million, an increase of 5.7% year-over-year, and adjusted net income per diluted share of $4.11, up 15.1% year-over-year. For the full year 2025, revenue reached a record $2.66 billion, and adjusted net income per share was $16.10.
- The company provided Q1 2026 revenue guidance of $650 million-$670 million and adjusted EPS guidance of $3.80-$4.00. For full year 2026, WEX expects revenue between $2.70 billion and $2.76 billion and adjusted EPS between $17.25 and $17.85.
- WEX is transitioning from an investment phase to a scaling phase in 2026, with operating leverage expected to drive meaningful margin expansion over the medium term, supported by $50 million in cost savings actions.
- The company generated $638 million in adjusted free cash flow in 2025 and plans to prioritize debt reduction, aiming for a leverage ratio below 3x by Q2 or Q3 2026.
- WEX reported Q4 2025 total revenue of $672.9 million, an increase of 5.7% year-over-year.
- GAAP net income per diluted share for Q4 2025 rose 50.6% to $2.41, while adjusted net income per diluted share increased 15.1% to $4.11.
- Performance was driven by higher fuel prices and strong growth in the Benefits segment, with revenue up 9.6% to $204.9 million, and the Corporate Payments segment, which saw revenue increase 17.8% to $122.9 million.
- The company maintained a healthy financial position with $1.25 billion in available liquidity and a leverage ratio of 3.1x as of December 31, 2025.
- WEX issued Q1 2026 guidance for net revenue between $650 million and $670 million, and adjusted net income per diluted share between $3.80 and $4.00.
- WEX delivered strong Q4 2025 results with revenue of $672.9 million, an increase of 5.7% year-over-year, and adjusted net income per diluted share of $4.11, up 15.1% year-over-year. For the full year 2025, the company achieved record revenue of $2.66 billion and adjusted net income per share of $16.10.
- The company provided 2026 guidance, projecting full-year revenue between $2.70 billion and $2.76 billion and adjusted EPS between $17.25 and $17.85 per diluted share. This represents a midpoint revenue growth of 5% and EPS growth of 13%, excluding the impact of fuel prices, FX rates, and interest rates.
- WEX is transitioning from an investment phase to a scaling phase in 2026, anticipating operating leverage and meaningful margin expansion over the medium term, supported by $50 million in cost savings actions. However, the adjusted operating income margin is expected to be flat with 2025 due to a negative impact from lower fuel prices.
- The company continues to prioritize debt reduction, ending Q4 2025 with a leverage ratio of 3.1 times and expecting to achieve a ratio below 3 times in Q2 or Q3 2026. WEX also plans to continue share buybacks given its current trading multiple.
- WEX reported Q4 2025 revenue of $672.9 million, a 5.7% increase year-over-year, and Adjusted Net Income per diluted share of $4.11, up 15.1%. For the full year 2025, revenue reached $2.66 billion and Adjusted Net Income per share was $16.10.
- For Q1 2026, WEX expects revenue between $650-$670 million and adjusted net income EPS between $3.80-$4.00. The full year 2026 guidance projects revenue of $2.70-$2.76 billion and adjusted net income EPS of $17.25-$17.85.
- The company generated $638 million in adjusted free cash flow in 2025 and reduced its leverage ratio to 3.1 times by Q4 2025, with a goal to be below 3 times by Q2 or Q3 2026.
- WEX plans to shift from an investment to a scaling phase in 2026, with operating leverage driving meaningful margin expansion over the medium term, and has embedded $50 million of cost savings actions in its 2026 guidance.
- David Foss will assume the role of Vice Chair and Lead Independent Director effective at the 2026 annual meeting, as part of a multi-year board refreshment plan.
- WEX reported Q4 2025 revenue of $672.9 million, an increase of 5.7% compared to the prior year, and full year 2025 revenue of $2.66 billion, up 1.2%.
- For Q4 2025, GAAP net income was $2.41 per diluted share (up 50.6%) and adjusted net income was $4.11 per diluted share (up 15.1%), while full year 2025 adjusted net income per diluted share increased 5.4% to $16.10.
- The company provided Q1 2026 net revenue guidance of $650 million to $670 million and full year 2026 net revenue guidance of $2,700 million to $2,760 million.
- Q1 2026 adjusted net income per diluted share is projected to be between $3.80 and $4.00, with full year 2026 adjusted net income per diluted share expected to range from $17.25 to $17.85.
- WEX reported Q4 2025 revenue of $672.9 million, a 5.7% increase compared to the prior year, and full year 2025 revenue of $2.66 billion, up 1.2%.
- For Q4 2025, adjusted net income per diluted share was $4.11, an increase of 15.1%, while full year 2025 adjusted net income per diluted share reached $16.10, up 5.4%.
- The company provided Q1 2026 revenue guidance in the range of $650 million to $670 million and adjusted net income per diluted share guidance of $3.80 to $4.00.
- For the full year 2026, WEX anticipates revenue between $2.70 billion and $2.76 billion and adjusted net income per diluted share from $17.25 to $17.85.
- WEX's leverage ratio improved to 3.1x as of December 31, 2025, and adjusted free cash flow for full year 2025 increased to $638.0 million from $562.0 million in 2024.
- WEX (NYSE: WEX) introduced a new Fleet card that consolidates traditional fuel and public EV charging payments into a single card, account, and invoice on its proprietary closed-loop network.
- This new card provides access to over 175,000 public charging ports and is accepted at over 90% of U.S. gas stations, aiming to simplify operations for mixed-energy fleets.
- Separately, WEX formed a virtual-card partnership with Nuvei to serve global travel merchants, underscoring a strategic push into both EV-oriented fleet payments and travel-payments flows.
- The company's stock is trading near $156.70, showing short-term gains but longer-term declines, with observers noting that broader adoption of these product moves will likely determine investor perception.
- WEX has introduced a new WEX Fleet card with EV payment capabilities, designed to unify payments for both traditional fuel and public electric vehicle (EV) charging.
- This offering makes WEX the first fuel card provider to integrate fueling and EV charging into a single card, account, and invoice across its proprietary closed-loop network.
- The card features embedded RFID technology for tap-to-charge functionality, eliminating the need for separate EV charging cards or mobile apps.
- It aims to simplify operations for mixed-energy fleets by providing consolidated reporting and controls and reducing administrative burden for fleet managers.
- WEX's strategic priorities for 2026 include enhancing its core business, extending its market reach into new areas like the owner-operator marketplace, and accelerating innovation through AI deployment.
- The company expects Q4 2024 spend volume and revenue trends to be largely in line with expectations, with strong sales momentum projected to benefit 2025 and 2026.
- In the Mobility segment, WEX reported a 12% increase in new sales with small businesses year over year and anticipates the BP migration in 2026 to be an incremental benefit. The Benefits segment is experiencing a strong Open Enrollment season and saw HSA accounts up 7% in Q3.
- WEX has lapped the OTA headwinds in its Corporate Payments segment, positioning it for more normalized growth, and has invested in new sales teams and product enhancements like AP Direct and Embedded Payments.
- WEX aims to reduce its leverage below 3x in the next year (from 3.25x in Q3) and maintains a bias towards share buybacks as a primary capital allocation strategy due to strong cash flow generation.
- WEX's key priorities for 2026 include enhancing its core business, extending its market reach, and accelerating innovation, with the BP migration and new product rollouts expected to provide incremental benefits.
- The company anticipates Q4 2024 spend volume and revenue trends to be largely in line with expectations, with strong sales momentum projected to benefit 2026.
- In the Mobility segment, WEX reported a 12% increase in new sales with small businesses year over year and expects macro headwinds to persist in the first half of 2026. The Benefits segment is seeing a strong open enrollment season and expects long-term benefits from expanded eligibility.
- WEX has lapped the OTA headwinds in Q3 for Corporate Payments, leading to more normalized growth, and continues to invest in product capabilities and sales, with sales team paybacks typically less than two years.
- WEX aims to reduce its leverage to below 3x in the next year and has a continued bias towards share buybacks as a capital allocation strategy due to their high risk-adjusted return.
Quarterly earnings call transcripts for WEX.
Ask Fintool AI Agent
Get instant answers from SEC filings, earnings calls & more