Earnings summaries and quarterly performance for CONOCOPHILLIPS.
Executive leadership at CONOCOPHILLIPS.
Ryan Lance
Chief Executive Officer
Andrew O’Brien
Senior Vice President, Strategy, Commercial, Sustainability and Technology
Kelly Rose
Senior Vice President, Legal, General Counsel and Corporate Secretary
Nicholas Olds
Executive Vice President, Lower 48
William Bullock
Executive Vice President and Chief Financial Officer
Board of directors at CONOCOPHILLIPS.
Arjun Murti
Director
David Seaton
Director
Dennis Arriola
Director
Gay Huey Evans
Director
Jeffrey Joerres
Director
Katie McGinty
Director
Nelda Connors
Director
R.A. Walker
Director
Robert Niblock
Lead Independent Director
Sharmila Mulligan
Director
Timothy Leach
Director
William McRaven
Director
Research analysts who have asked questions during CONOCOPHILLIPS earnings calls.
Arun Jayaram
JPMorgan Chase & Co.
8 questions for COP
Scott Hanold
RBC Capital Markets
8 questions for COP
Stephen Richardson
Evercore ISI
8 questions for COP
Betty Jiang
Barclays
6 questions for COP
Kevin MacCurdy
Pickering Energy Partners
6 questions for COP
Lloyd Byrne
Jefferies LLC
6 questions for COP
Neil Mehta
Goldman Sachs
6 questions for COP
Paul Cheng
Scotiabank
6 questions for COP
Charles Meade
Johnson Rice & Company L.L.C.
5 questions for COP
Devin Mcdermott
Morgan Stanley
5 questions for COP
Ryan Todd
Simmons Energy
5 questions for COP
Bob Brackett
Bernstein Research
4 questions for COP
Doug Leggate
Wolfe Research
4 questions for COP
James West
Evercore ISI
4 questions for COP
Leo Mariani
ROTH MKM
4 questions for COP
Nitin Kumar
Mizuho Securities USA
4 questions for COP
Douglas George Blyth Leggate
Wolfe Research
3 questions for COP
Joshua Silverstein
UBS Group AG
3 questions for COP
Phillip Jungwirth
BMO Capital Markets
3 questions for COP
Alastair Syme
Citigroup
2 questions for COP
Charles Arthur Meade
Johnson Rice
2 questions for COP
Francis Lloyd Byrne
Jefferies
2 questions for COP
Jeoffrey Lambujon
TPH & Co.
2 questions for COP
Neal Dingmann
Truist Securities
2 questions for COP
Neil Singhvi Mehta
Goldman Sachs Group
2 questions for COP
Paul Chang
Scotiabank
2 questions for COP
Sam Margolin
Wells Fargo & Company
2 questions for COP
Wei Jiang
Barclays
2 questions for COP
David Deckelbaum
TD Cowen
1 question for COP
Douglas Leggate
Wolfe Research
1 question for COP
Kalei Akamine
Bank of America
1 question for COP
Kaleinoheaokealaula Akamine
Bank of America
1 question for COP
Phillips Johnston
Capital One Securities, Inc.
1 question for COP
Roger Read
Wells Fargo & Company
1 question for COP
Ryan M. Todd
Piper Sandler & Co.
1 question for COP
Recent press releases and 8-K filings for COP.
- CEO Ryan Lance said the company will focus on recouping roughly $10 billion from arbitration awards tied to nearly two-decade-old Venezuelan nationalizations before pursuing new oil investments there.
- ConocoPhillips has already recorded about $12 billion in write-downs on its Venezuela ventures.
- Production reached 2.32 million boe/d, marking 6.3% year-over-year growth.
- Shares slipped about 2.9% after Q4 adjusted earnings missed expectations.
- The company’s financial position includes a $129.29 billion market cap, $59.79 billion in trailing 12-month revenue, and an Altman Z-Score of 3.09.
- 2.5% pro forma production growth in 2025; Q4 production of 2.32 MM BOE/d.
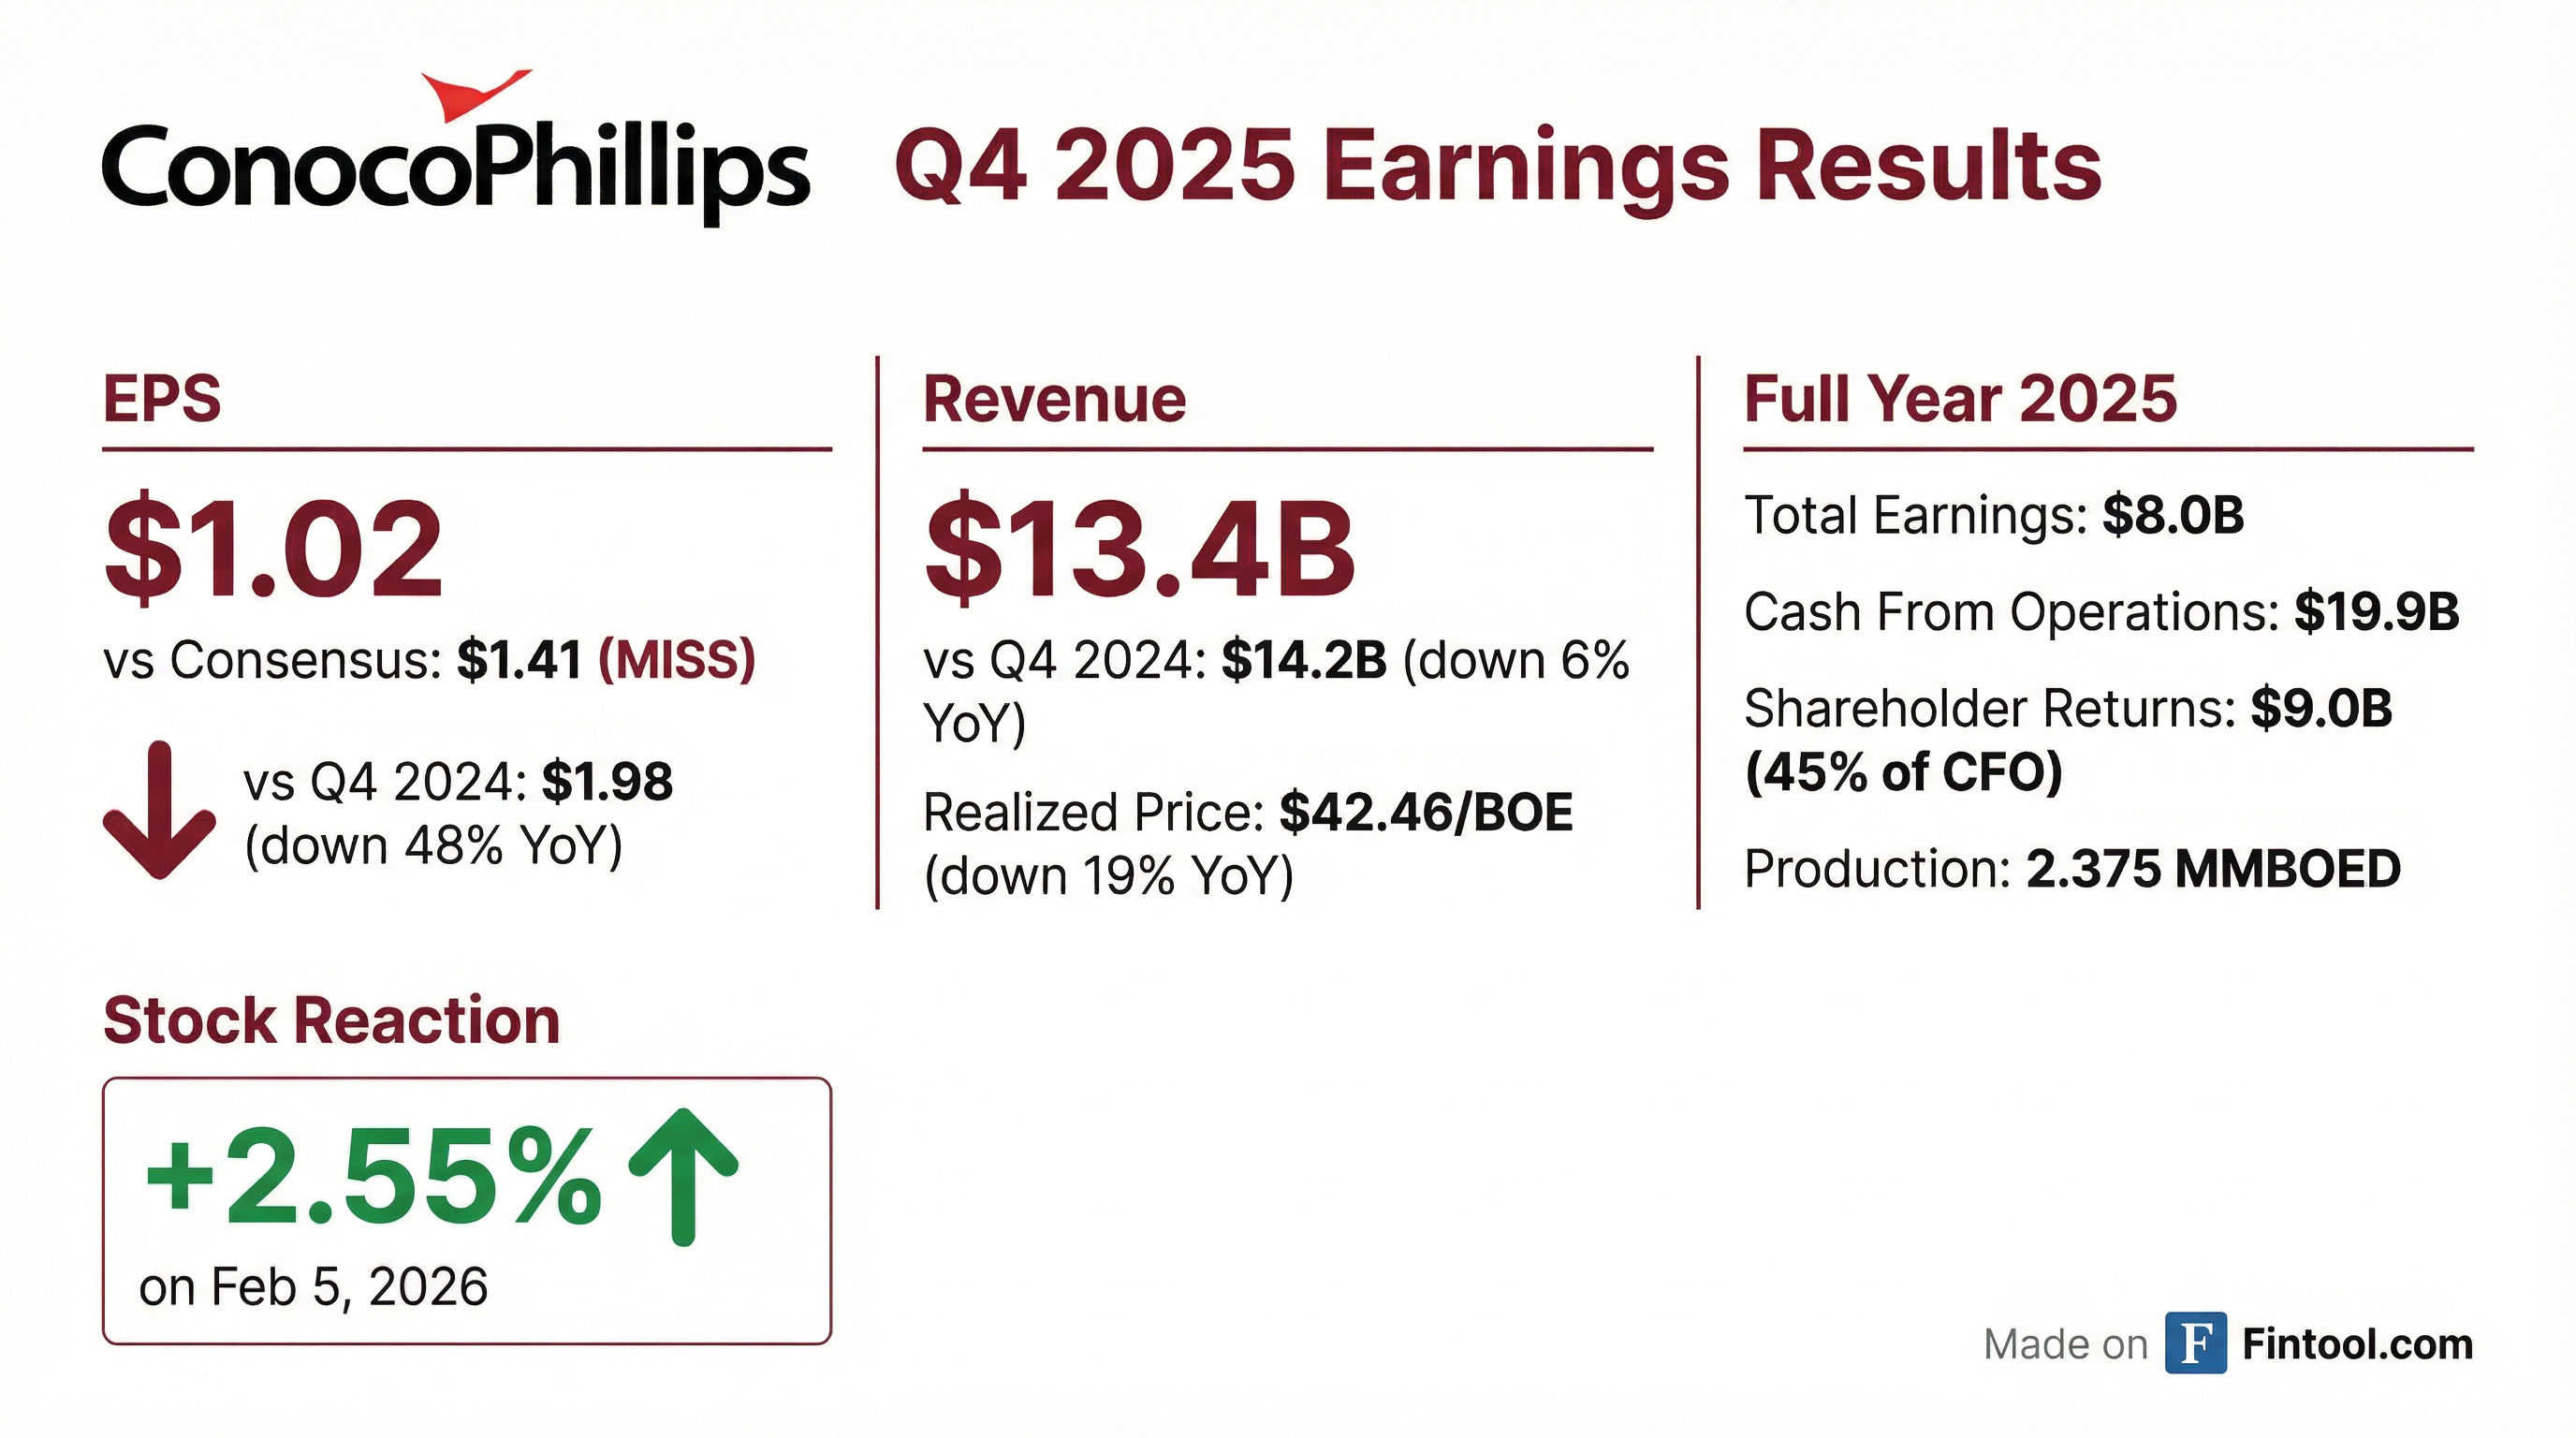
- Q4 adjusted earnings of $1.02 /share and $4.3 B cash from operations; full-year CapEx of $12.6 B and $3 B in asset sales.
- Returned $9 B of capital (45% of CFO) via $1 B buybacks and $1 B dividends in Q4; net debt down $2 B, cash at $7.4 B.
- 2026 guidance: CapEx $12 B, OpEx $10.2 B, production 2.23–2.26 MM BOE/d, and ~45% of CFO returned to shareholders.
- Integrated Marathon Oil, launched a $1 B cost-reduction initiative, grew LNG offtake to ~10 Mtpa, and advanced major projects to boost free cash flow through 2029.
- 2.32 MMboe/d production in Q4; $1.02 adjusted EPS; $4.3 B cash from operations; $3 B Q4 CapEx; returned $2.1 B in Q4 (incl. $1 B buybacks, $1 B dividends)
- Full-year 2025: $12.6 B CapEx; $9 B return of capital (45% of CFO); paid down $900 M debt; net debt down nearly $2 B; ending cash & ST investments $7.4 B; LT investments $1.1 B
- 2026 Outlook: $12 B CapEx (–$0.6 B YoY); $10.2 B OpEx (–$0.4 B); production 2.23–2.26 MMboe/d; Q1 2.30–2.34 MMboe/d; target $1 B combined CapEx & cost reduction; return ~45% of CFO
- Successfully integrated Marathon Oil: doubled synergy capture, realized $1 B one-time benefits, eliminated acquired CapEx while achieving pro forma production growth
- Advancing major projects: NFS LNG >80% complete for H2 2026 start-up; Willow ~50% complete, on track for early-2029 first oil; Lower 48 drilling/completion efficiency +15% in 2025
- ConocoPhillips delivered Q4 2025 production of 2.32 MMboe/d, adjusted EPS of $1.02, and $4.3 B of cash flow from operations; Q4 CapEx was $3 B, bringing full-year CapEx to $12.6 B.
- Returned $2.1 B of capital in Q4 (≈$1 B buybacks and $1 B dividends), reaching $9 B or 45% of CFO for 2025; net debt fell by ≈$2 B to strengthen the investment-grade balance sheet.
- 2026 guidance calls for $12 B of CapEx (down $0.6 B YoY), $10.2 B of operating costs (down $0.4 B), and production of 2.23–2.26 MMboe/d, with ~45% CFO return and continued dividend growth.
- Projects and cash flow outlook: targeting $1 B of incremental free cash flow annual improvement from 2026–28, leading to a $7 B inflection by 2029, including $4 B from Willow in 2029.
- Q4 2025 adjusted earnings fell ~50% to $1.02 per share, missing estimates as realized oil prices dropped to an average $42.46/boe, despite a 6.3% rise in production to 2.320 mmboe/d.
- The company maintained its 2026 guidance of $12 billion in capital spending, $10.2 billion in operating costs and production of 2.33–2.36 million boe/d, and announced a targeted $1 billion reduction in combined capital and operating costs.
- Management returned 45% of 2025 cash flow to shareholders—$9.0 billion ($5.0 billion in buybacks and $4.0 billion in dividends)—and the stock fell about 3.9%, hitting an intraday low of $103.15 on Feb. 5.
- ConocoPhillips reported Q4 2025 EPS of $1.17 and adjusted EPS of $1.02; FY 2025 EPS was $6.35 and adjusted EPS was $6.16.
- Generated CFO of $19.9 billion in 2025, returning 45% ($9.0 billion) to shareholders via $5.0 billion of buybacks and $4.0 billion of dividends; ended the year with cash and short-term investments of $7.4 billion and declared a Q1 2026 dividend of $0.84 per share.
- Completed the integration of Marathon Oil, doubling synergy capture to over $1 billion on a run-rate basis in 2025.
- Provided 2026 guidance including ~$12 billion of capital expenditures, $10.2 billion of adjusted operating costs and production of 2.33–2.36 MMBOED.
- Reported Q4 2025 EPS of $1.17 and full-year EPS of $6.35, with adjusted EPS of $1.02 in Q4 and $6.16 for the year.
- 2026 guidance: ~$12 billion in capital expenditures, ~$10.2 billion in adjusted operating costs and production of 2.33–2.36 MMBOED (Q1: 2.30–2.34 MMBOED).
- Declared Q1 2026 dividend of $0.84/share and plans to return 45% of CFO to shareholders.
- Generated $19.9 billion CFO in 2025 and distributed $9.0 billion (including $5.0 billion in buybacks and $4.0 billion in dividends).
- Completed Marathon Oil integration, capturing > $1 billion of run-rate synergies; delivered 2,375 MBOED in 2025 with 2.5% organic growth.
- On Dec. 22, 2025, Permian Resources announced a holding-company reorganization under which management and long-term holders will exchange Class C shares for Class A shares and the company privately issued 48.9 million new Class A shares to simplify its Up-C structure toward a single share class by 2027.
- The company executed an Eleventh Amendment to its credit agreement with JPMorgan Chase and a syndicate of lenders to permit the transaction and maintain access to existing credit facilities.
- Post-transaction share counts will be roughly 793.8 million Class A shares and 35.5 million Class C shares; management owns over 6% of the company.
- Reported financial metrics include a 30.1% three-year revenue growth, 39.09% operating margin, 15.65% net margin, an Altman Z-Score of 1.7 (in the distress zone), and both current and quick ratios of 0.67.
- Market capitalization is approximately $10.48 billion.
- Freehold Royalties reported $74 million in revenue and $59 million in funds from operations (FFO; $0.36/share) in Q3 2025.
- The company paid $44 million in dividends ($0.27/share) and reduced net debt by $7.3 million, resulting in 1.1x net debt to FFO.
- Production averaged 16,054 boe/d, a 10% year-over-year increase, with 65% liquids weighting.
- The average realized price was $48.92/boe, including a 33% premium on U.S. production.
- ConocoPhillips increased the projected cost of its Willow oil and gas project in Alaska to $8.5–9 billion, attributing the rise to inflation and higher North Slope construction expenses, while maintaining a schedule for first oil in early 2029.
- The project is about 50% complete, expected to yield 600 million barrels over 30 years with peak output of 180,000 bpd, and to generate $1 billion in annual free cash flow from 2026–2028 toward a $7 billion incremental target by 2029.
- Willow leverages existing infrastructure in the 23.5 million-acre National Petroleum Reserve–Alaska and connects to the Trans-Alaska Pipeline System, enhancing transportation efficiency and U.S. energy independence.
- ConocoPhillips raised its quarterly dividend by 8% to $0.84 per share, increased full-year production guidance to 2.375 million boe/d, and lowered operating cost guidance to $10.6 billion.
Quarterly earnings call transcripts for CONOCOPHILLIPS.
Ask Fintool AI Agent
Get instant answers from SEC filings, earnings calls & more