Earnings summaries and quarterly performance for GENUINE PARTS.
Executive leadership at GENUINE PARTS.
William P. Stengel, II
President and Chief Executive Officer
Alain Masse
President, North America Automotive
Bert Nappier
Executive Vice President and Chief Financial Officer
Christopher T. Galla
Senior Vice President, General Counsel and Corporate Secretary
Naveen Krishna
Executive Vice President and Chief Information and Digital Officer
Board of directors at GENUINE PARTS.
Charles K. Stevens, III
Director
Court Carruthers
Director
Darren Rebelez
Director
Donna W. Hyland
Director
Jean-Jacques Lafont
Director
Juliette W. Pryor
Director
Laurie Schupmann
Director
Matt Carey
Director
P. Russell Hardin
Director
Paul D. Donahue
Non-Executive Chairman
Richard Cox, Jr.
Director
Research analysts who have asked questions during GENUINE PARTS earnings calls.
Bret Jordan
Jefferies
11 questions for GPC
Michael Lasser
UBS
11 questions for GPC
Scot Ciccarelli
Truist Securities
10 questions for GPC
Christopher Horvers
JPMorgan Chase & Co.
6 questions for GPC
Kate McShane
Goldman Sachs
6 questions for GPC
Gregory Melich
Evercore ISI
5 questions for GPC
Greg Malik
TD Securities
4 questions for GPC
Christian Carlino
JPMorgan Chase & Co.
3 questions for GPC
Chris Dankert
Loop Capital
2 questions for GPC
Chris Horvers
JPMorgan
2 questions for GPC
Christopher Dankert
Loop Capital Markets
2 questions for GPC
Greg Melich
Evercore
2 questions for GPC
Katharine McShane
Goldman Sachs Group, Inc.
2 questions for GPC
Mark Jordan
Goldman Sachs Group, Inc.
2 questions for GPC
Seth Basham
Wedbush Securities
2 questions for GPC
Carolina Jolly
Gabelli Funds
1 question for GPC
Recent press releases and 8-K filings for GPC.
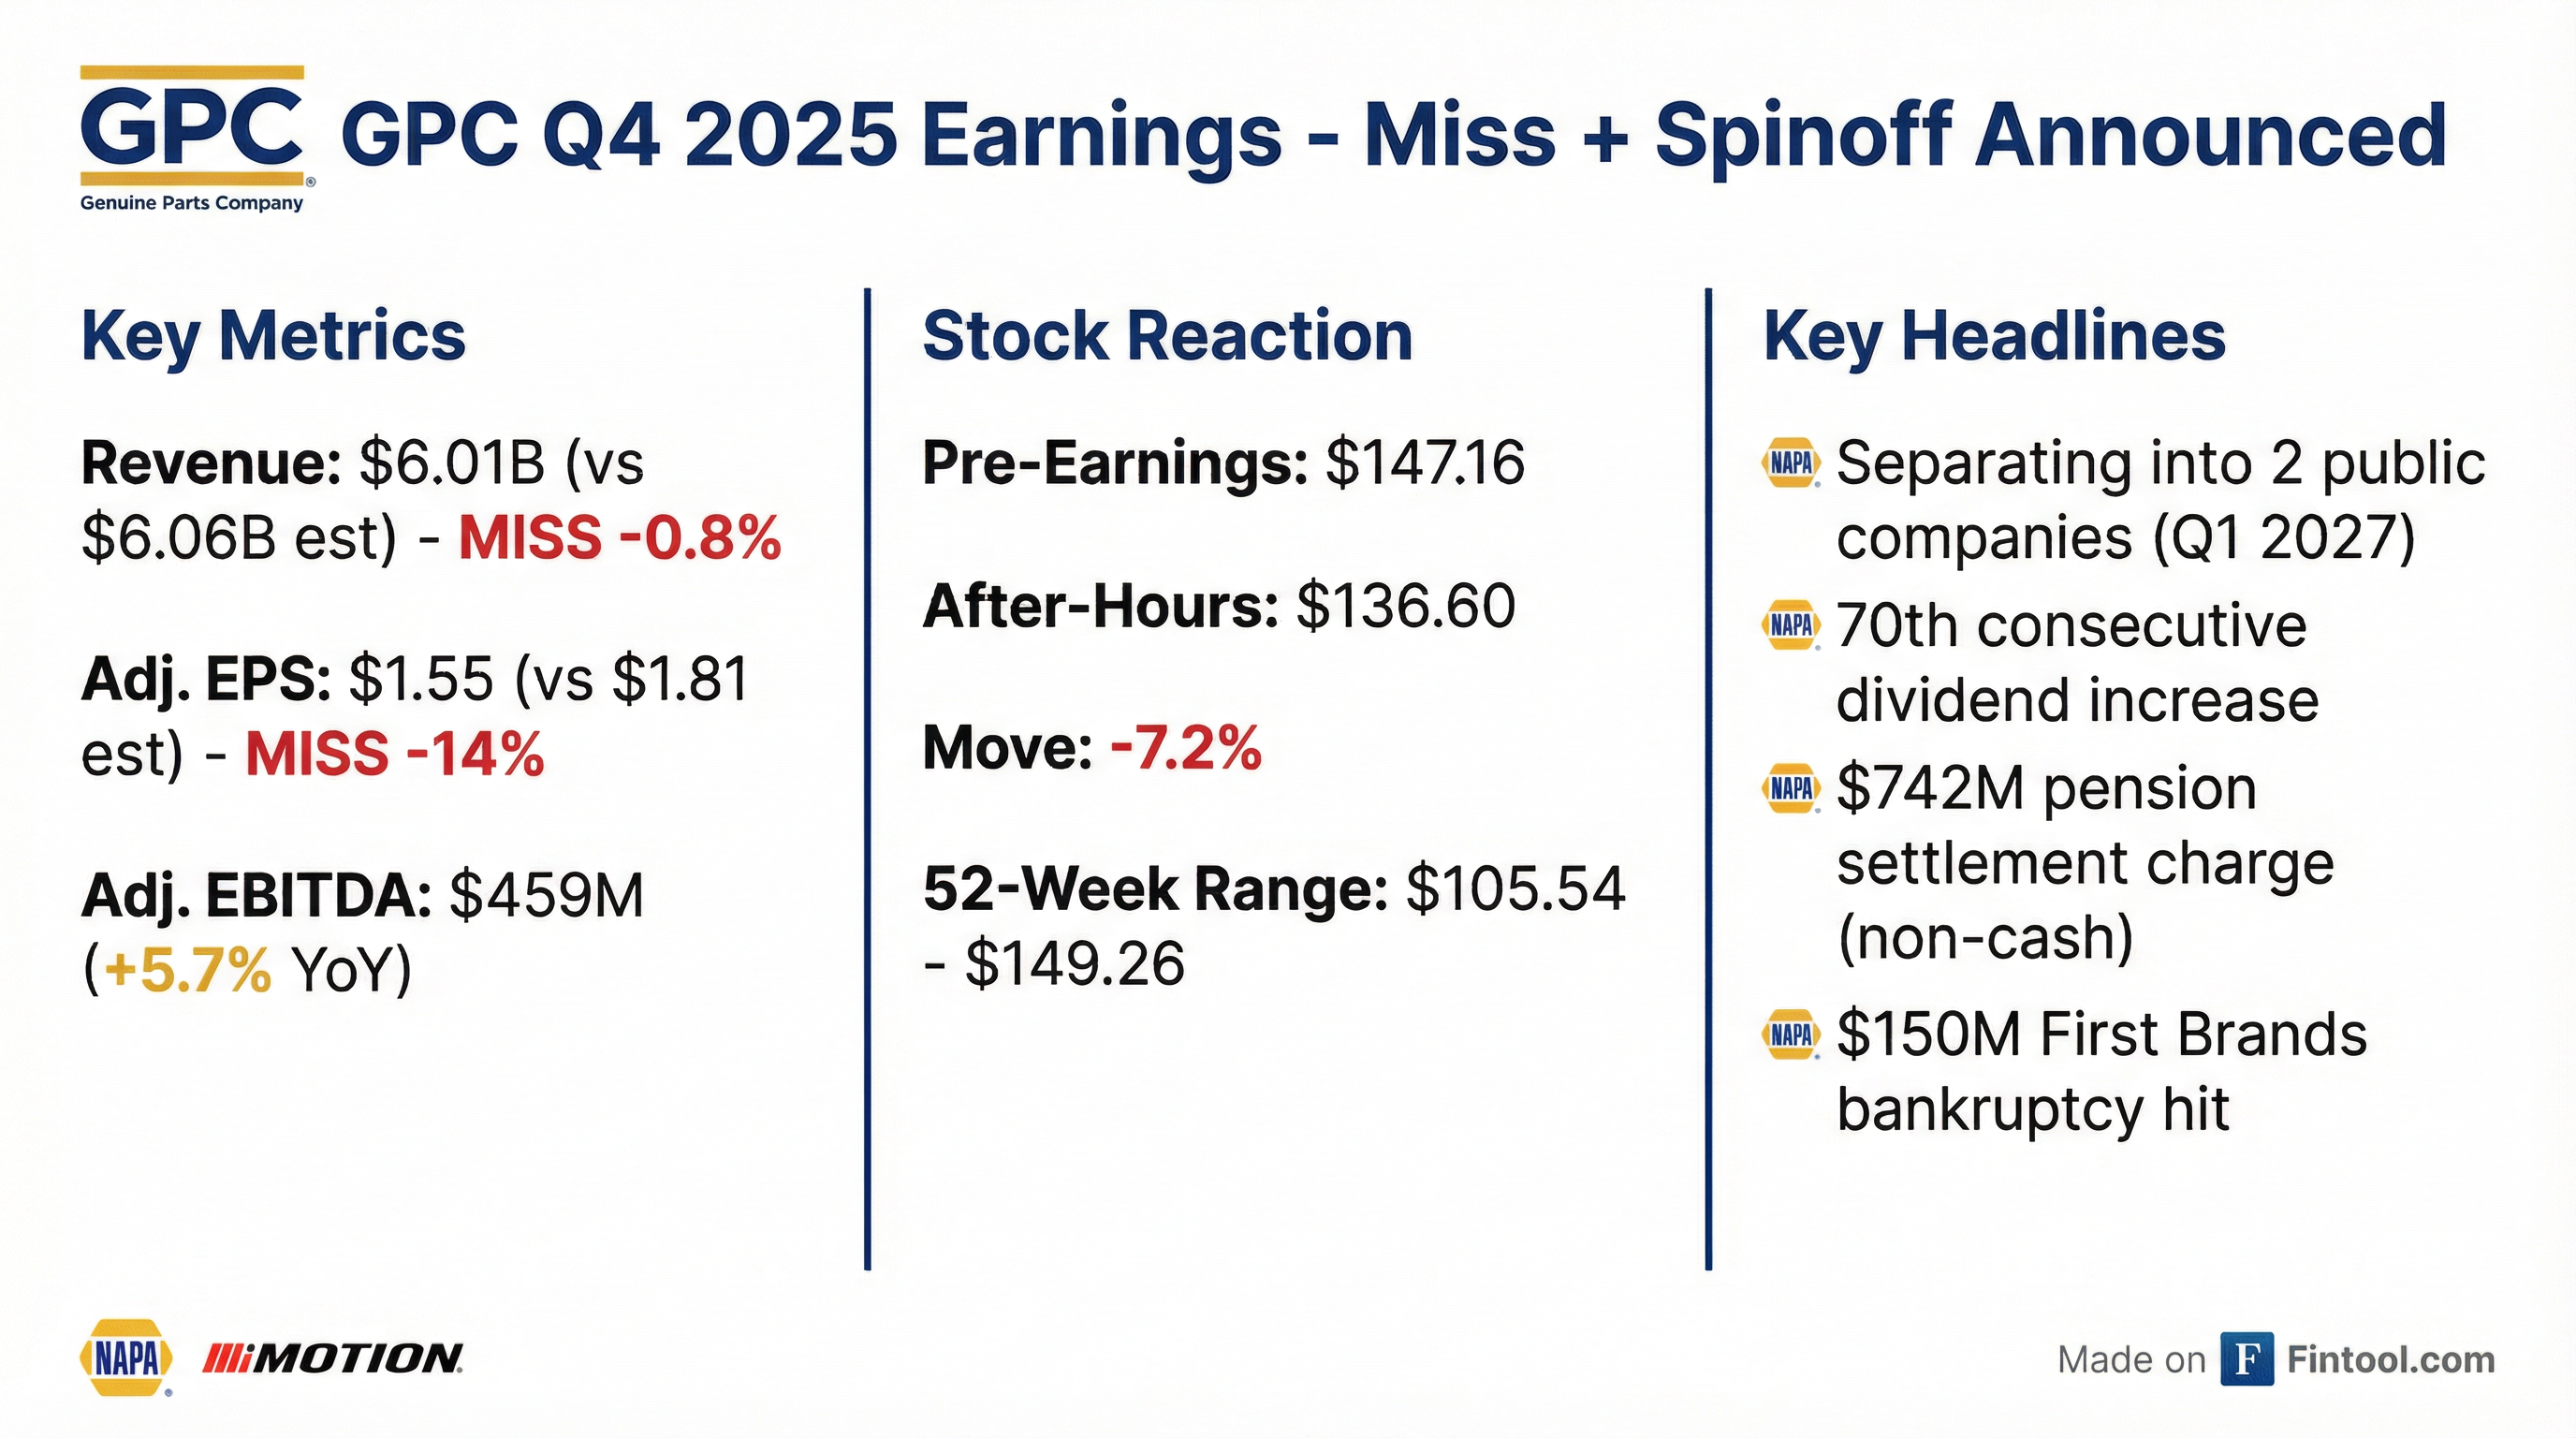
- Genuine Parts will separate into independent Motion (industrial) and automotive (NAPA) public companies to enhance strategic focus and operational agility through tailored leadership and investment.
- Both entities will target an investment-grade capital structure, ensuring continuity of the auto aftermarket’s supply chain finance program for cost-effective operations.
- The Motion segment sees a tailwind from a recovering manufacturing backdrop (PMI > 50) and is leveraging past cost initiatives to drive topline growth and margin expansion with minimal incremental investment.
- The company has launched proprietary ChatGPC within its AI governance framework, with 6,000 active users to optimize inventory deployment and sales effectiveness.
- The NAPA automotive business began 2026 with mid-single-digit same-store growth, supporting confidence in full-year performance underpinned by sales execution and restructuring gains.
- Genuine Parts Company will separate into two public companies—an industrial “Motion” business and an automotive/NAPA business—to unlock value, increase agility, and allow each to pursue targeted growth and margin opportunities independently .
- Both businesses will target investment-grade capital structures, ensuring cost-effective supply chain financing remains intact for the automotive aftermarket operations .
- The industrial Motion segment is seeing early 2026 tailwinds, with PMI readings above 50, positive backlog trends, and leverage potential from disciplined cost management without major incremental cost cuts ** **.
- The NAPA business expects another 40–60 bp of gross-margin expansion in 2026 through strategic sourcing and pricing technology, building on a mid‐single‐digit revenue start to Q1 .
- Genuine Parts is accelerating AI adoption via its proprietary ChatGPC platform (6,000 active users) and improved data governance to drive inventory optimization and sales effectiveness .
- Raymond James upgraded GPC to Strong Buy with a $145 price target, implying roughly 25% upside from current levels.
- The firm’s sum-of-the-parts valuation assigns 15x forward EBITDA to Motion, 10x to North America Auto and 8x to International Auto.
- Separation of the Auto (NAPA) and Industrial (Motion) businesses is expected by Q1 2027, with investor days planned in 2H 2026.
- Key risks include continued weakness in the European auto aftermarket, North American pricing pressure or Motion trading at lower multiples.
- Brightpick formed a strategic partnership with NAPA (Genuine Parts) to deploy AI-powered warehouse robots across distribution centers, enhancing throughput and accuracy.
- Following a successful 2025 pilot, NAPA signed an agreement in early 2026 for an additional site deployment featuring over 100 Brightpick robots, with potential for further rollouts.
- This deal marks Brightpick’s first automotive sector engagement and its largest U.S. customer to date, demonstrating scalability with Fortune 500 companies.
- Brightpick’s goods-to-person robots will integrate with NAPA’s existing technologies to optimize order picking, buffering, consolidation, dispatch, and stock replenishment.
- NAPA operates nearly 6,000 Auto Parts stores in the U.S., supported by a nationwide distribution network and over 560,000 parts, reinforcing the partnership’s scale and impact.
- Plans to separate into two investment-grade, publicly traded companies—Global Automotive (NAPA) and Global Industrial (Motion)—targeting completion in Q1 2027 to unlock shareholder value and tailor strategies.
- Q4 2025 sales rose 4%, adjusted gross margin expanded 70 bps, and adjusted EPS was $1.55, with headwinds from depreciation, interest expense, and lost pension income.
- Full-year 2025 adjusted net income was $1.0 billion ($7.37/share), free cash flow was $421 million, and restructuring delivered $175 million of cost savings.
- 2026 guidance calls for adjusted EPS of $7.50–$8.00 (+5% at midpoint), total sales growth of 3%–5.5%, and adjusted EBITDA of $2.0 billion–$2.2 billion.
- Genuine Parts to separate into two independent, publicly traded companies: Global Automotive (NAPA aftermarket parts) and Global Industrial (industrial solutions).
- Q4 2025 sales grew 4% with adjusted gross margin expansion of 70 bps; adjusted EPS was $1.55, down due to depreciation, interest expense, and lost pension income.
- North America comp sales +4%; Europe sales down 2% (local currency) with comp sales down 3%; Asia Pacific sales and comp sales both +5% in Q4.
- 2026 outlook calls for adjusted EPS of $7.50–8.00 (+5% at midpoint vs. 2025), sales growth of 3–5.5%, and adjusted EBITDA of $2.0–2.2 billion, driven by gross margin expansion and restructuring savings.
- Full-year 2025 revenue totaled $24.3 billion with an 8.3% adjusted EBITDA margin, though results fell below expectations due to softer Q4 sales.
- The Board declared the 70th consecutive annual dividend increase, setting FY 2026 cash dividends at $4.25 per share (+3.2% year-over-year).
- Management reiterated plans to separate Global Automotive and Global Industrial into two independent public companies, targeting completion in Q1 2027.
- For 2026, GPC forecasts total sales growth of 3–5.5%, adjusted EBITDA of $2.0–2.2 billion, diluted EPS of $6.10–6.60, and free cash flow of $550–700 million.
- Q4 2025: $6.0 B sales (+4.1%), adjusted gross margin 37.6% (+70 bps), adjusted EBITDA $459 M (+5.7%), adjusted EBITDA margin 7.6% (+10 bps), adjusted EPS $1.55 (−3.7%)
- FY 2025: $24.3 B sales (+3.5%), adjusted gross margin 37.5% (+90 bps), adjusted EBITDA $2.0 B (+0.5%), adjusted EBITDA margin 8.3% (−20 bps), adjusted EPS $7.37 (−9.7%)
- Board approved plan to separate Global Automotive and Global Industrial into two independent, publicly traded companies
- 2026 outlook: total sales growth 3.0–5.5%, adjusted EBITDA $2.0–2.2 B, adjusted EPS $7.50–$8.00
- Announces intent to split into two publicly traded companies—Global Automotive (NAPA) and Global Industrial (Motion)—targeting completion in Q1 2027 to unlock value and tailor growth strategies.
- Reports full-year 2025 sales of $24.3 billion (+3.5%), with 37.6% adjusted gross margin in Q4; full-year adjusted net income of $1 billion ($7.37 EPS) and Q4 adjusted net income of $216 million ($1.55 EPS).
- 2025 segment revenue: Industrial sales $8.9 billion (+2%), North America Automotive sales +3% (comparable +0.5%), International Automotive sales +5% (comparable slight increase).
- 2026 outlook calls for 3%–5.5% total sales growth, adjusted EPS of $7.50–$8.00, 40–60 bps gross margin expansion and $2.0 billion–$2.2 billion adjusted EBITDA.
- Q4 2025 net sales of $6.0 billion, up 4.1% year-over-year, driven by 1.7% comparable sales, 1.5% acquisition growth and 0.9% favorable FX impact.
- GAAP net loss of $609 million (EPS $(4.39)) in Q4; adjusted net income of $216 million (EPS $1.55) with an adjusted gross profit margin of 37.6%, up 70 bps.
- Full-year 2025 net sales of $24.3 billion (+3.5%), GAAP net income of $66 million (EPS $0.47) and adjusted net income of $1.0 billion (EPS $7.37).
- Declared a 3.2% dividend increase, raising the quarterly payout to $1.0625 per share for Q1 2026—marking the 70th consecutive year of dividend hikes.
- Announced a tax-free separation into two independent public companies—Global Automotive and Global Industrial—targeted in Q1 2027.
Fintool News
In-depth analysis and coverage of GENUINE PARTS.

Quarterly earnings call transcripts for GENUINE PARTS.
Ask Fintool AI Agent
Get instant answers from SEC filings, earnings calls & more