Earnings summaries and quarterly performance for HUNTINGTON INGALLS INDUSTRIES.
Executive leadership at HUNTINGTON INGALLS INDUSTRIES.
Christopher D. Kastner
President and Chief Executive Officer
Brian D. Blanchette
Executive Vice President and President, Ingalls Shipbuilding
Brooke A. Hart
Executive Vice President, Communications
Chad N. Boudreaux
Executive Vice President and Chief Legal Officer
Christopher W. Soong
Executive Vice President and Chief Information Officer
Edgar A. Green III
Executive Vice President and President, Mission Technologies
Edmond E. Hughes
Executive Vice President and Chief Human Resources Officer
Eric D. Chewning
Executive Vice President, Strategy and Development
Kara R. Wilkinson
Executive Vice President and President, Newport News Shipbuilding
Nicolas G. Schuck
Corporate Vice President, Controller and Chief Accounting Officer
Paul C. Harris
Executive Vice President, Chief Sustainability and Compliance Officer
Stephen R. Powell
Corporate Vice President and Treasurer
Stewart H. Holmes
Executive Vice President, Government and Customer Relations
Thomas E. Stiehle
Executive Vice President and Chief Financial Officer
Todd R. Borkey
Executive Vice President and Chief Technology Officer
Board of directors at HUNTINGTON INGALLS INDUSTRIES.
Anastasia D. Kelly
Director
Augustus L. Collins
Director
Craig S. Faller
Director
Frank R. Jimenez
Director
John K. Welch
Director
Kirkland H. Donald
Chairman of the Board
Leo P. Denault
Director
Nick L. Stanage
Director
Stephanie L. O’Sullivan
Director
Thomas C. Schievelbein
Director
Tracy B. McKibben
Director
Victoria D. Harker
Director
Research analysts who have asked questions during HUNTINGTON INGALLS INDUSTRIES earnings calls.
Myles Walton
Wolfe Research, LLC
8 questions for HII
Scott Mikus
Melius Research
8 questions for HII
Seth Seifman
JPMorgan Chase & Co.
8 questions for HII
Gautam Khanna
TD Cowen
7 questions for HII
Noah Poponak
Goldman Sachs
7 questions for HII
Scott Deuschle
Deutsche Bank
6 questions for HII
Ronald Epstein
Bank of America
5 questions for HII
Jason Gursky
Citigroup Inc.
4 questions for HII
David Strauss
Barclays
3 questions for HII
Douglas Harned
Sanford C. Bernstein & Co., LLC
3 questions for HII
Peter Skibitski
Alembic Global Advisors
3 questions for HII
Robert Stallard
Vertical Research Partners
3 questions for HII
Doug Harned
Bernstein
2 questions for HII
Mariana Perez Mora
Bank of America
2 questions for HII
Pete Skibitski
Alembic Global
2 questions for HII
Jordan Lyonnais
Bank of America
1 question for HII
Joshua Korn
Barclays PLC
1 question for HII
Michael Mccormick
Sanford C. Bernstein & Co.
1 question for HII
Recent press releases and 8-K filings for HII.
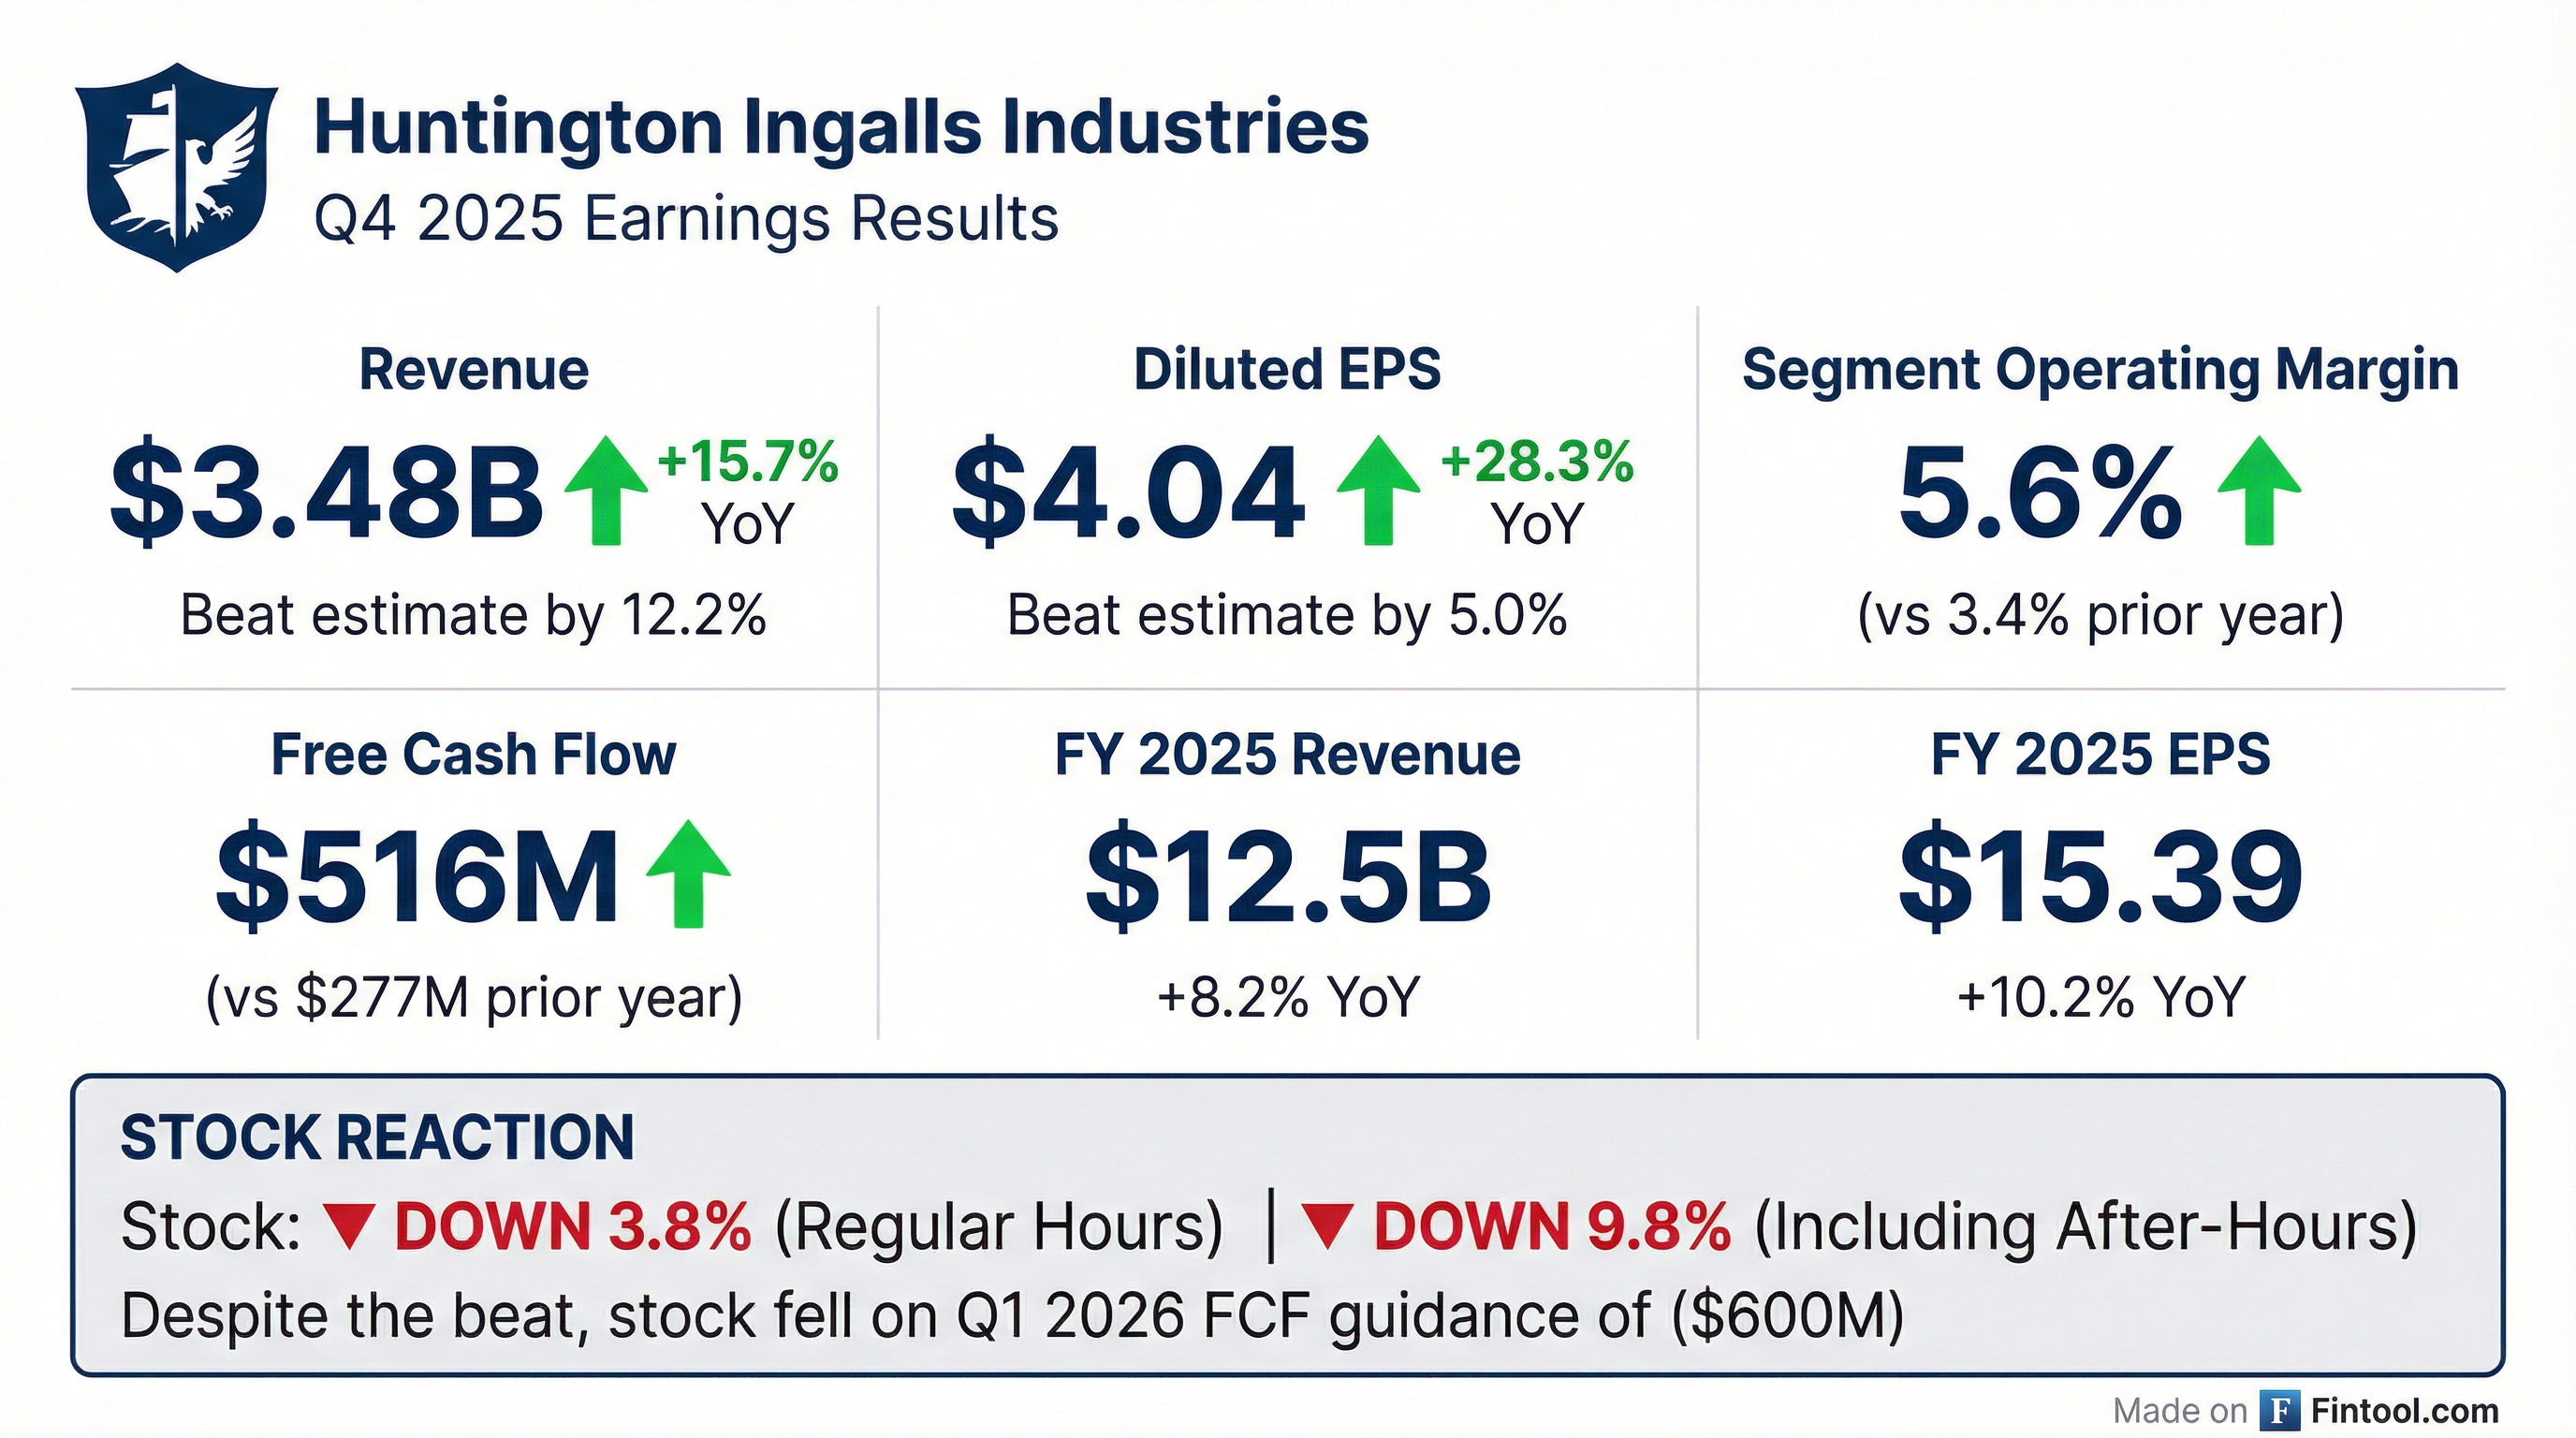
- Huntington Ingalls reported full-year 2025 revenues of $12.5 B (+8.2%) and EPS of $15.39, with Q4 revenues of $3.5 B (+16%) and EPS of $4.04.
- The company raised its medium-term shipbuilding revenue CAGR guidance to ~6% and projects 2026 shipbuilding revenues of $9.7–9.9 B with margins of 5.5–6.5%; Mission Technologies revenues are expected at $3.0–3.2 B with 8.4–8.6% EBITDA margin and free cash flow of $500–600 M.
- Operational initiatives delivered a 14% increase in shipbuilding throughput in 2025, supported by hiring over 6,600 shipbuilders, doubling outsourcing in 2025, and targeting 15% throughput growth and 30% additional outsourcing in 2026.
- Capital expenditures totaled $396 M (3.2% of sales) in 2025, with 2026 capex guidance at 4–5% of sales to expand yard capacity and throughput.
- The FY 2026 National Defense Authorization and Appropriations Acts provide bipartisan support with incremental and block-buy funding for aircraft carriers, Virginia- and Columbia-class submarines, DDG-51, and new frigate programs.
- Revenue: Q4 2025 revenues of $3.5 billion (+16% YoY) and full-year $12.5 billion (+8.2% YoY).
- Profitability: Q4 segment operating margin of 5.6% (vs 3.4% YoY) yielding net earnings of $159 million and EPS of $4.04; full-year EPS of $15.39 (vs $13.96 prior year).
- Cash flow & liquidity: 2025 free cash flow of $800 million, capital expenditures of $396 million (3.2% of sales), ending cash of $774 million and liquidity of $2.5 billion.
- 2026 outlook: Free cash flow guidance of $500–600 million, medium-term top-line CAGR of ~6%, effective tax rate of ~17%, and Q1 2026 shipbuilding revenues of $2.3 billion with Mission Technologies revenues of $700–750 million.
- Q4 2025 revenues of $3.5 billion, up 16% YoY; net earnings $159 million and EPS $4.04 vs $3.15
- FY 2025 revenues of $12.5 billion, up 8.2%; Ingalls $3.1 billion (+11.2%), Newport News $6.5 billion (+9%)
- 2026 guidance: shipbuilding revenues $9.7–9.9 billion with margins 5.5–6.5%; Mission Technologies revenues $3.0–3.2 billion at ~5% margin; free cash flow $500–600 million
- Medium-term top-line CAGR raised to ~6% (shipbuilding ~6%, Mission Tech ~5%) vs prior ~4% shipbuilding CAGR
- Operational initiatives include a 14% throughput increase in 2025 (15% target for 2026), hiring 6,600+ shipbuilders in 2025, doubling outsourcing in 2025 with a 30% increase planned in 2026, and capex of 4–5% of sales
- Q4 2025 revenue of $3,476 million, up 15.7% YoY.
- Segment operating income of $195 million (5.6% margin) versus $103 million (3.4%) in Q4 2024.
- Free cash flow of $516 million in Q4 on $650 million of operating cash; FY 2025 FCF was $800 million.
- 2026 outlook: Shipbuilding revenue of $9.7–9.9 billion (5.5–6.5% margin), Mission Technologies revenue of $3.0–3.2 billion (~5% margin), and FCF of $500–600 million.
- HII’s fourth quarter 2025 revenue was $3.5 billion, up 15.7% year-over-year, with diluted EPS of $4.04 versus $3.15 in Q4 2024.
- Full year 2025 revenue reached $12.5 billion, an 8.2% increase over 2024, and diluted EPS of $15.39 versus $13.96 in 2024.
- For FY 2026, HII expects shipbuilding revenue of $9.7 billion–$9.9 billion with operating margin of 5.5%–6.5%, Mission Technologies revenue of $3.0 billion–$3.2 billion (EBITDA margin 8.4%–8.6%), and free cash flow of $500 million–$600 million.
- HII hosted Gen. Bradford Gering and fellow Marine Corps officers at its Pascagoula yard, touring two amphibious warships under construction—Bougainville (LHA 8) and Harrisburg (LPD 30).
- Ingalls is building two LHA-class assault ships (LHA 8 Bougainville, LHA 9 Fallujah) and three LPD Flight II transport docks (LPD 30 Harrisburg, LPD 31 Pittsburgh, LPD 32 Philadelphia).
- In September 2024, Ingalls received a contract for three San Antonio-class LPDs (LPD 33–35) and a modification for the fifth America-class ship (LHA 10 Helmand Province).
- The visit underscored the amphibious warship program as a top priority for Navy and Marine Corps readiness and global mission support.
- HII’s Mission Technologies division is one of 12 awardees on the 10-year, $25.4 billion Advanced Technology Support Program V (ATSP5) indefinite-delivery/indefinite-quantity contract to support U.S. Department of Defense and civilian agencies with advanced microelectronics and engineering solutions.
- The contract scope spans hardware and software services—including studies, analysis, design, simulation, fabrication, prototyping, integration, testing and limited production—to address obsolescence and accelerate deployment of critical systems.
- HII engineers will leverage over two decades of expertise in reverse engineering, microelectronics assurance and model-based technical approaches to sustain and modernize previously obsolete systems.
- HII’s Mission Technologies division won the Missile Defense Agency’s SHIELD IDIQ with a $151 billion ceiling to advance layered homeland defense capabilities.
- The contract spans work in directed energy, command-and-control integration, data and cyber operations, microelectronics, spectrum management, live/virtual/constructive training, and logistics.
- Financial context: HII reported $12.01 billion in revenue, a 7.4% three-year growth rate, 12.52% gross margin, and 4.56% operating margin, amid a market cap near $16.15 billion.
- HII, the nation’s largest independent military shipbuilder with a 135+ year heritage and 44,000 employees, emphasized the award’s role in accelerating innovation and fielding for warfighters.
- HII’s Mission Technologies division secured the Missile Defense Agency’s Scalable Homeland Innovative Enterprise Layered Defense (SHIELD) IDIQ contract, with a $151 billion ceiling.
- The contract enables rapid competition and delivery of advanced capabilities, including directed energy, command and control integration, cyber operations, microelectronics, spectrum management, training environments, logistics, and sustainment.
- The award underscores HII’s commitment to advancing all-domain homeland defense solutions through its proven expertise in systems integration and defense technologies.
- HII hosted Secretary of the Navy John Phelan, CNO Adm. Daryl Caudle, and Commandant Gen. Eric Smith for a tour of Ingalls Shipbuilding to discuss workforce initiatives and the yard’s role in the Navy’s “Golden Fleet” effort.
- Ingalls is supporting early engineering and design for the Navy’s next battleship and was selected to design and construct the future small surface combatant platform based on the Legend-class cutter.
- The leaders observed advanced manufacturing technologies in action and toured the amphibious assault ship Bougainville (LHA 8) and the recently delivered destroyer Ted Stevens (DDG 128).
- HII has invested over $1 billion in infrastructure, facilities, and advanced toolsets at Ingalls to boost production capacity for upcoming programs.
Fintool News
In-depth analysis and coverage of HUNTINGTON INGALLS INDUSTRIES.

Quarterly earnings call transcripts for HUNTINGTON INGALLS INDUSTRIES.
Ask Fintool AI Agent
Get instant answers from SEC filings, earnings calls & more