Earnings summaries and quarterly performance for HONEYWELL INTERNATIONAL.
Executive leadership at HONEYWELL INTERNATIONAL.
Vimal Kapur
Chief Executive Officer
James Currier
President and CEO, Aerospace Technologies
Mike Stepniak
Senior Vice President and Chief Financial Officer
Peter Lau
President and CEO, Industrial Automation
Su Ping Lu
Senior Vice President, General Counsel and Corporate Secretary
Board of directors at HONEYWELL INTERNATIONAL.
D. Scott Davis
Director
Deborah Flint
Director
Duncan Angove
Director
Grace Lieblein
Director
Kevin Burke
Director
Michael Lamach
Director
Robin Watson
Director
Rose Lee
Director
Stephen Williamson
Director
William Ayer
Lead Independent Director
Research analysts who have asked questions during HONEYWELL INTERNATIONAL earnings calls.
Christopher Snyder
Morgan Stanley
9 questions for HON
Julian Mitchell
Barclays Investment Bank
9 questions for HON
Nigel Coe
Wolfe Research, LLC
9 questions for HON
Scott Davis
Melius Research
9 questions for HON
Sheila Kahyaoglu
Jefferies
9 questions for HON
Deane Dray
RBC Capital Markets
7 questions for HON
Amit Mehrotra
UBS
5 questions for HON
Andrew Kaplowitz
Citigroup
5 questions for HON
Andrew Obin
Bank of America
5 questions for HON
Joe Ritchie
Goldman Sachs
4 questions for HON
Nicole DeBlase
Deutsche Bank
4 questions for HON
Steve Tusa
JPMorgan Chase & Co.
4 questions for HON
C. Stephen Tusa
JPMorgan Chase & Co.
3 questions for HON
Joseph Ritchie
Goldman Sachs
3 questions for HON
Andy Kaplowitz
Citigroup Inc.
2 questions for HON
Nicole DeBlase
BofA Securities
2 questions for HON
Stephen Tusa
J.P. Morgan
2 questions for HON
Deane Drey
RBC Capital Markets
1 question for HON
Recent press releases and 8-K filings for HON.
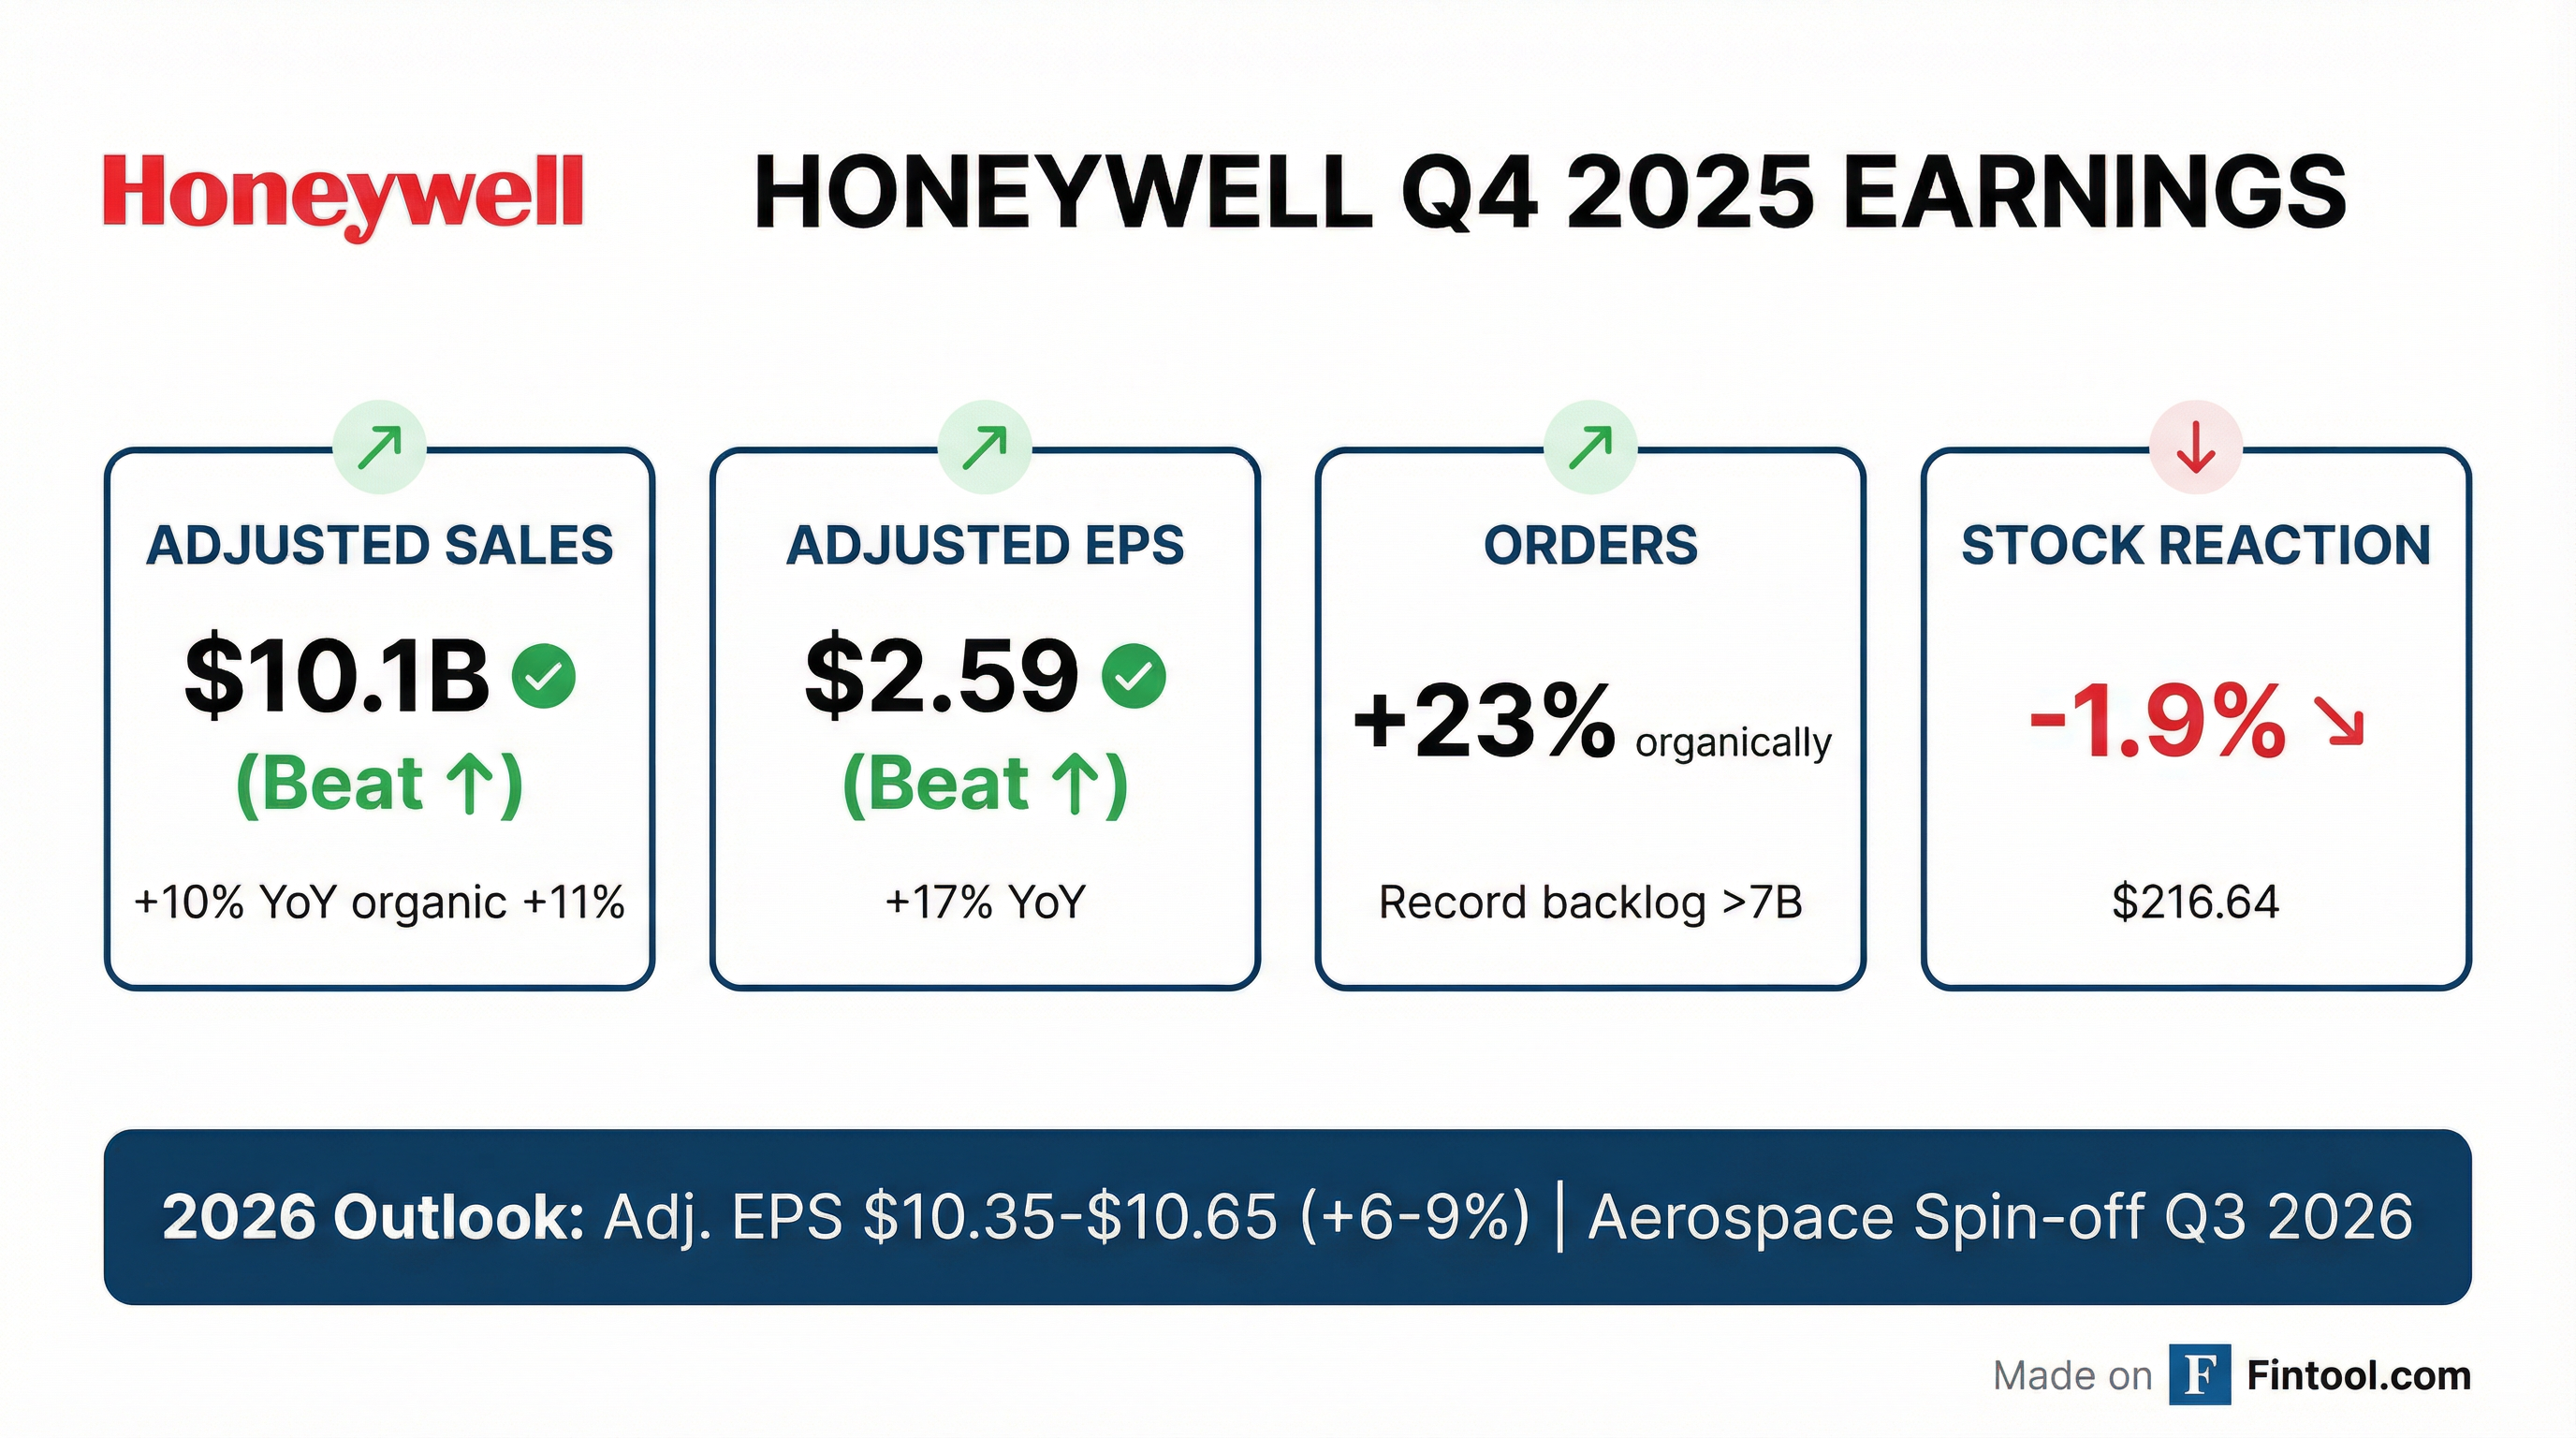
- Orders up 23% and backlog topped $37 billion; Q4 revenue was $9.76 billion (adjusted $10.07 billion, +11% organic) and adjusted EPS $2.59.
- Aerospace sales grew 13% to $4.52 billion (21% organic) and building automation rose 10% to $1.97 billion, while industrial automation declined 8%.
- Reported net income dropped to $309 million due to one-time asset sale and litigation charges, weighing on margins.
- Completed the Solstice Advanced Materials spin, moved the planned Aerospace spin to Q3 2026, and issued 2026 guidance of $38.8–$39.8 billion in sales and $10.35–$10.65 adjusted EPS.
- Q4 2025: Adjusted EPS of $2.59 (up 17% YoY), organic orders +23%, backlog >$37 B, and organic sales +6% excluding Bombardier impact
- FY 2025: Organic sales +7% (6% excl. Bombardier), adj. EPS $9.78 (+12%), and free cash flow $5.1 B (+20%)
- 2025 capital deployed $10 B (incl. $3.8 B share repurchases), Q4 debt repayment $2.3 B, and $900 M returned to shareholders
- 2026 guidance: Sales $38.8–39.8 B (+3–6% organic), segment margin 22.7–23.1%, adj. EPS $10.35–10.65 (+6–9%), FCF $5.3–5.6 B (~14% margin)
- Q4 organic sales growth of 11% (6% ex-2024 Bombardier agreement) driven by aerospace (+11%) and building automation (+8%); orders up 23%, backlog exceeds $37 billion.
- Adjusted EPS of $2.59, up 17% year-over-year (down 3% ex-Bombardier), and free cash flow of $2.5 billion, up 48% (13% ex-Bombardier).
- Full-year 2025 organic sales up 7% (6% ex-Bombardier), adjusted EPS $9.78 (+12%) and free cash flow $5.1 billion (+20%).
- 2026 guidance for adjusted EPS of $10.35–$10.65 (+6%–9%) and free cash flow of $5.3–$5.6 billion, reflecting volume, pricing and productivity improvements.
- Portfolio actions: Solstice Advanced Materials spin completed; aerospace spin targeted in Q3 2026; sale processes for Productivity Solutions & Services and Warehouse & Workflow Solutions underway in H1 2026.
- Honeywell delivered a strong Q4 and FY 2025, with orders up 23% and a $37 billion backlog, exiting the year with 6% sales growth excluding the 2024 Bombardier agreement.
- Completed spin-off of Solstice Advanced Materials on October 30, 2025; expects the aerospace separation in Q3 2026 and will report four simplified segments going forward.
- Quantinuum raised $840 million at a $10 billion pre-money valuation, launched the Helios quantum computer, and partnered with NVIDIA to integrate quantum and AI capabilities.
- 2026 guidance: adjusted EPS $10.35–$10.65 (+6%–9%), free cash flow $5.3–$5.6 billion (≈14% margin), and Q1 organic sales growth of 3%–5%; full-year organic growth expected: aerospace high single-digit, building automation mid single-digit, PNT flat, industrial automation flat to down.
- In 2025, deployed $10 billion of capital: $3.8 billion share repurchases, $3.0 billion dividends, $2.2 billion acquisitions, $1.0 billion CapEx, and repaid $3.8 billion of debt.
- Adjusted sales of $10.1 B (up 11% organic) and EPS of $2.67; free cash flow of $2.5 B in Q4 2025.
- Q4 orders grew 23%, driving a record backlog and supporting sustained organic growth and margin expansion.
- Portfolio transformation on track: Aerospace separation now expected in 3Q 2026, with investor days for both entities in June 2026.
- FY 2026 guidance: sales of $38.8 B–$39.8 B (up 3–6% organically), segment margin of 22.7–23.1%, and EPS of $10.35–$10.65.
- Fourth-quarter sales of $9.8 B (+6%), adjusted sales of $10.1 B (+10%; +11% organic).
- GAAP EPS of $0.49 and adjusted EPS of $2.59 (+17%).
- Orders up 23% organically; backlog exceeds $37 B.
- 2026 outlook: adjusted EPS of $10.35–$10.65 (+6–9%).
- Aerospace spin-off now expected in Q3 2026.
- Fourth quarter sales of $9.8 billion, up 6%; adjusted sales of $10.1 billion, up 10% (11% organic growth)
- Fourth quarter GAAP EPS of $0.49, adjusted EPS of $2.59
- Orders rose 23% organically, driving backlog above $37 billion
- 2026 guidance: sales of $38.8 billion–$39.8 billion (3%–6% organic growth); adjusted EPS of $10.35–$10.65
- Honeywell Aerospace spin-off now expected in third quarter 2026; leadership team announced
- Honeywell Aerospace will become an independent, publicly traded company in the second half of 2026 on Nasdaq under the ticker HONA, headquartered in Phoenix, Arizona.
- Josh Jepsen will join as Chief Financial Officer effective February 23, transitioning from his role as SVP & CFO at Deere & Company.
- Bob Buddecke, Dave Marinick and Rich DeGraff have been named Presidents and CEOs of the Electronic Solutions, Engines & Power Systems and Control Systems units, respectively, all reporting to CEO Jim Currier.
- As a standalone company, Honeywell Aerospace will rank among the largest pure-play aerospace suppliers with over $15 billion in 2024 sales.
- Honeywell settled 2023 litigation with Flexjet over its HTF7000-series engine-maintenance service agreement.
- The settlement includes extending the HTF7000 maintenance contract through 2035.
- The deal could involve $470 million in one-time cash payments and reduce Q4 2023 sales by $310 million and operating income by $370 million.
- Honeywell’s aerospace segment accounted for 37% of 2023 revenue, with 30% from recurring aftermarket services, underscoring the settlement’s strategic impact.
- $220 million investment to expand ballistic fiber production at Colonial Heights/Chesterfield County, VA, adding fiber spinning, composite coating and analytical capabilities
- Construction and equipment installation slated for 2025–2029, with operational ramp through Sept. 30, 2030, and creation of 100 full-time jobs by 2029
- Project supported by $3.5 million in state and local grants; SOLS shares rose 5.6–5.8% on the announcement
- Analyst consensus one-year price target of $58.69 (range $50–$70) with a consensus Outperform recommendation (2.3)
Fintool News
In-depth analysis and coverage of HONEYWELL INTERNATIONAL.


Quarterly earnings call transcripts for HONEYWELL INTERNATIONAL.
Ask Fintool AI Agent
Get instant answers from SEC filings, earnings calls & more