Earnings summaries and quarterly performance for Johnson Controls International.
Executive leadership at Johnson Controls International.
Joakim Weidemanis
Chief Executive Officer
Anu Rathninde
Vice President and President, APAC
John Donofrio
Executive Vice President and General Counsel
Julie Brandt
Vice President and President, Global Commercial & Field Operations
Lei Schlitz
Vice President and President, Global Products & Solutions
Marc Vandiepenbeeck
Executive Vice President and Chief Financial Officer
Richard Lek
Vice President and President, EMEA
Todd Grabowski
Vice President and President, Americas
Board of directors at Johnson Controls International.
Ayesha Khanna
Director
Gretchen Haggerty
Director
Jean Blackwell
Director
John Young
Director
Jürgen Tinggren
Lead Independent Director
Mark Vergnano
Chairman of the Board
Patrick Decker
Director
Pierre Cohade
Director
Roy Dunbar
Director
Swamy Kotagiri
Director
Tim Archer
Director
Research analysts who have asked questions during Johnson Controls International earnings calls.
Andrew Obin
Bank of America
7 questions for JCI
Christopher Snyder
Morgan Stanley
7 questions for JCI
Julian Mitchell
Barclays Investment Bank
7 questions for JCI
Nigel Coe
Wolfe Research, LLC
7 questions for JCI
Scott Davis
Melius Research
7 questions for JCI
Amit Mehrotra
UBS
6 questions for JCI
Joe Ritchie
Goldman Sachs
4 questions for JCI
Steve Tusa
JPMorgan Chase & Co.
4 questions for JCI
Andrew Kaplowitz
Citigroup
3 questions for JCI
C. Stephen Tusa
JPMorgan Chase & Co.
3 questions for JCI
Deane Dray
RBC Capital Markets
3 questions for JCI
Jeffrey Sprague
Vertical Research Partners
3 questions for JCI
Joe O'Dea
Wells Fargo
3 questions for JCI
Joseph Ritchie
Goldman Sachs
3 questions for JCI
Nicole DeBlase
BofA Securities
3 questions for JCI
Noah Kaye
Oppenheimer & Co. Inc.
3 questions for JCI
Andy Kaplowitz
Citigroup Inc.
2 questions for JCI
Jeff Sprague
Vertical Research
2 questions for JCI
Joseph O'Dea
Wells Fargo & Company
2 questions for JCI
Joseph O'Dea
Wells Fargo
1 question for JCI
Nicole DeBlase
Deutsche Bank
1 question for JCI
Sahil Manocha
RBC Capital Markets
1 question for JCI
Stephen Volkmann
Jefferies
1 question for JCI
Recent press releases and 8-K filings for JCI.
- Johnson Controls announced the capability acquisition of Alloy to integrate its differentiated CDU technology, supporting an existing pipeline of nearly $1 billion in data center cooling orders.
- The company delivered an unprecedented 40% order growth in Q4 and sustained double-digit pipeline expansion exiting the quarter—a first in the CFO’s 21-year tenure.
- North American manufacturing capacity was tripled two years ago, with “soft” capacity enhancements underway; however, accelerating demand may outpace supply, and most new orders are scheduled for 2027 delivery.
- A global self-help program—encompassing cost elimination, functional simplification, and factory network consolidation—is underway to improve operating margins.
- Portfolio optimization continues with the divestiture of two residential security businesses and planned further non-core sales; management does not view a larger acquisition as necessary to sustain its data center leadership.
- Johnson Controls completed a capability acquisition of Alloy, a Boston‐based engineering firm with Stack Forging technology, to differentiate its CDU products and extend its data center cooling portfolio.
- The company launched its new CDU product 4–5 months ago and has already built a $1 billion sales pipeline with immediate order bookings, aiming to secure a leadership position in the CDU market.
- In Q4, JCI achieved 40% order growth in its commercial HVAC business—driven by hyperscaler and colocation demand—and exited the quarter with double-digit pipeline growth, an unprecedented result in over two decades.
- Management expects the majority of Q1 orders to convert to revenue in 2027, as hard and “soft” capacity expansions work to keep pace with accelerating data center demand and delivery timelines.
- Ongoing self-help initiatives—including factory consolidations, operating model simplification, and restructuring—are targeting improved margins and high single-digit to potentially double-digit organic growth in the Americas HVAC segment.
- Johnson Controls acquired Alloy, a Boston-based engineering firm specializing in advanced CDU and cold plate technologies, bolstering its data center cooling capabilities and growing its pipeline to ~$1 billion following the CDU product launch.
- Commercial HVAC orders grew 40% in the fourth quarter, with the entry pipeline up double digits and an exit pipeline that still expanded double digits, driven by hyperscaler and colo demand and differentiated chiller technology.
- The company tripled hard manufacturing capacity in North America two years ago and is enhancing soft capacity through process improvements; most new data center orders are slated for 2027 delivery, with electrical infrastructure delays of 3–4 months.
- Americas segment organic HVAC growth is expected at high single-digit to double-digit levels, although a heavier equipment mix (35–36% margin) versus services (≈45% margin) is tempering short-term margin expansion.
- JCI is divesting non-mission-critical residential security assets and focusing on mission-critical, AI data center, and decarbonization verticals, while targeting bolt-on technology acquisitions like Alloy rather than large transformative deals.
- Johnson Controls has completed a portfolio simplification program, divesting ~30% of revenue to eliminate stranded costs, boost cash flow and margins, and is deploying a multi-year business system with 80/20 simplification and unified KPIs to drive growth and margin expansion.
- The company announced the acquisition of Alloy Enterprises, which brings proprietary “stack-forging” thermal management technology to enhance its data-center CDU solutions by ~35% efficiency over existing direct-to-chip cooling; close expected in Q3 FY26.
- Fiscal Q1 data-center orders rose 40% (56% in Americas) with backlog up 20%, and management reports the pipeline remains up double-digits, supporting an expectation of continued strong order growth.
- Johnson Controls targets long-term operating margins >30%, with a roadmap to high-30s/40% through service-margin improvements, manufacturing-footprint consolidation and SG&A cost reductions; service revenue is guided to high single-digit growth leveraging AI-enabled tools for technicians.
- Johnson Controls has simplified its portfolio by divesting ~30% of revenue, driving margin improvement and cash flow, and is rolling out a business system with lean, 80/20 and digital initiatives anchored by enterprise-wide KPIs for customers, people and shareholders.
- The company will acquire Alloy Enterprises to integrate proprietary next-gen thermal management IP into its data center thermal solutions, targeting 35% greater efficiency and closing the deal in its fiscal Q3 2026.
- Data center orders surged by 40% and backlog by 20% in Q1 FY 2026 , while ex-data center verticals such as pharma/biologics also saw double-digit order and backlog growth with a healthy pipeline remaining.
- Long-term EBIT margin target remains 30%+, with potential to reach the high-30s or 40% through service margin optimization, manufacturing footprint consolidation and SG&A cost reductions.
- Johnson Controls has simplified its portfolio by divesting ~30% of revenue-generating assets and is rolling out a multi-year business system—combining simplified processes, 80/20 prioritization and digital tools—with unified KPIs from leadership to market level to drive margin improvement and growth.
- The company agreed to acquire Alloy Enterprises to bolster next-gen thermal management for data centers, integrating proprietary stack-forging technology to deliver solutions 35% more efficient than current direct-to-chip cooling products; closing is expected in fiscal Q3 2026.
- In fiscal Q1 2026, JCI reported 40% order growth and 20% backlog growth, driven by data center and biopharma builds, with a CDU pipeline approaching $1 billion after just six months on market.
- Management targets long-term operating margins above 30%, aiming to expand gross margins via service margin improvement (currently ~45%), manufacturing footprint consolidation, and SG&A reductions, with potential to reach high-30s/40% over time.
- The service segment is poised for high single-digit revenue growth, leveraging AI-enabled connected tools to boost technician productivity and shifting toward productized, outcome-based contracts to reduce customer attrition.
- Johnson Controls signed an agreement to acquire Alloy Enterprises, a Boston-based thermal management innovator for high-performance data centers, offering up to 35% improved efficiency and 75% reduced pressure drop.
- The deal expands JCI’s leadership in the rapidly growing data center cooling segment and aligns with its strategy to unlock next-generation cooling innovation.
- The transaction is expected to close in fiscal Q3, subject to closing conditions and regulatory approvals, with financial terms undisclosed.
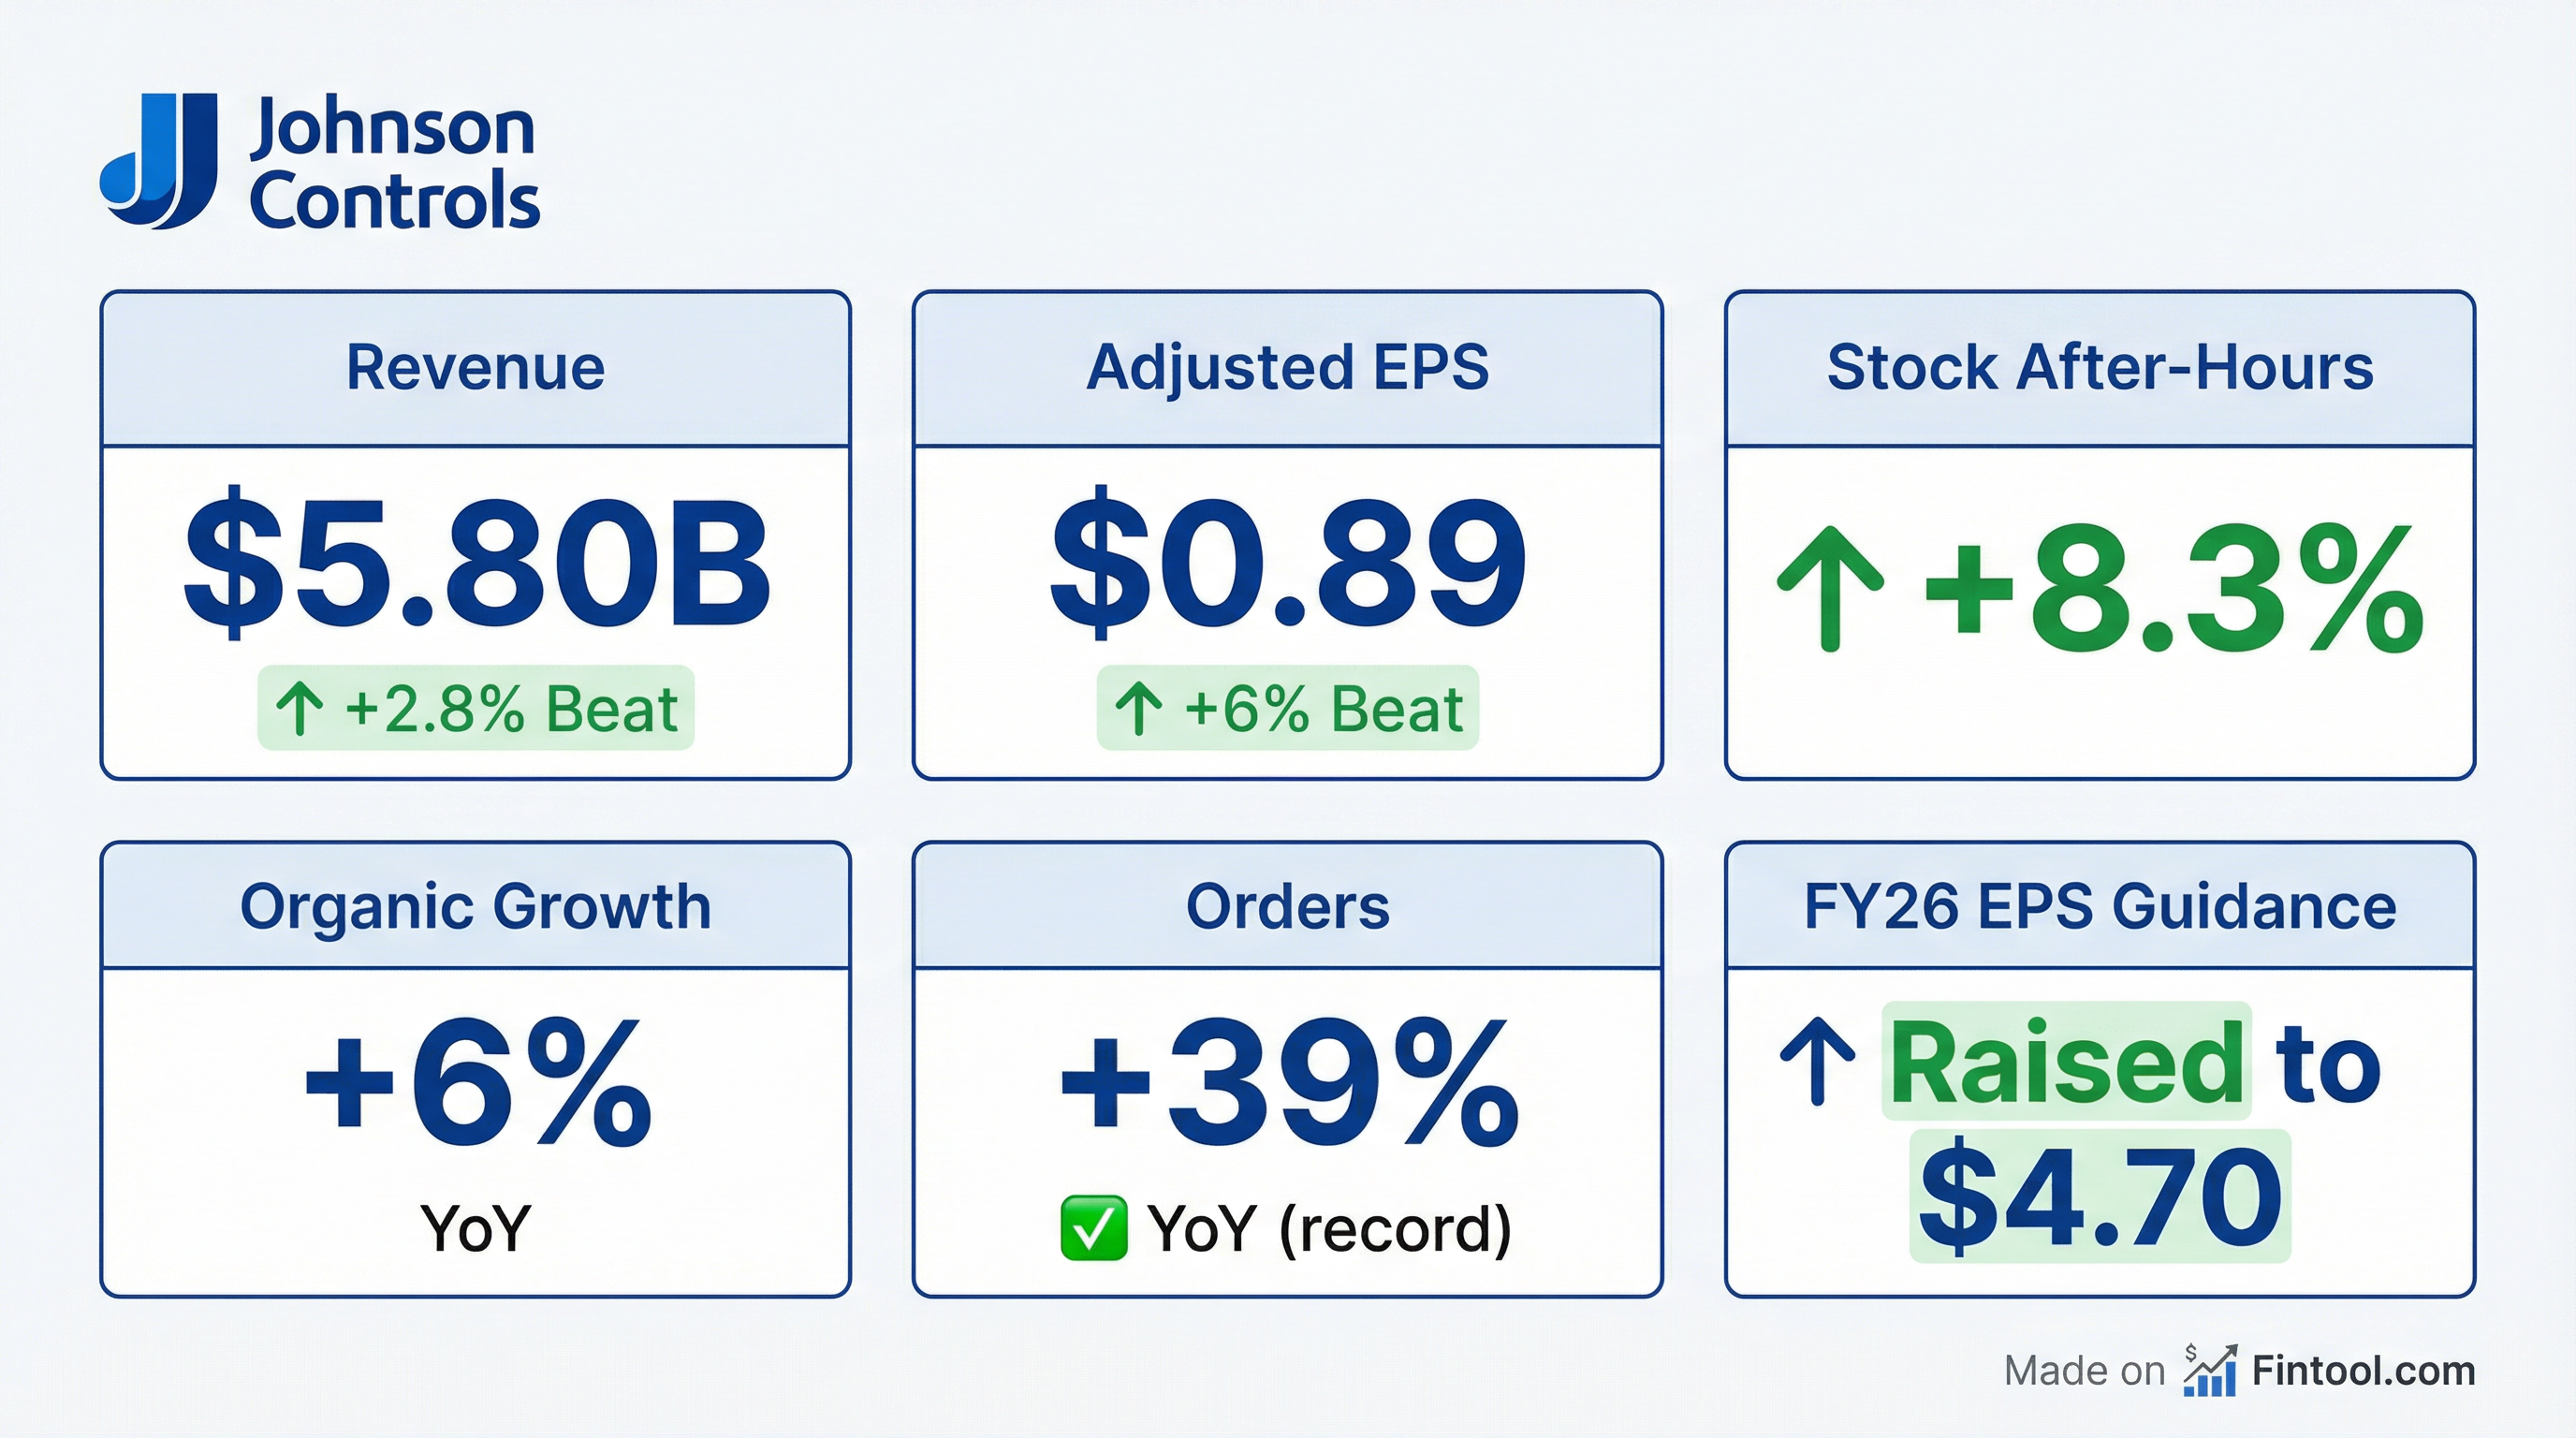
- Organic sales growth of 6% with broad-based strength
- Adjusted EBIT margin expanded 190 bps to 12.4%
- Adjusted EPS rose 39% to $0.89, with orders up ~40% and backlog at $18 billion
- Raised full-year 2026 adjusted EPS guidance by ~25% to $4.70, expecting ~100% free cash flow conversion
- Orders rose nearly 40% year-over-year; record backlog reached $18 billion (up 20%), led by strong data center and life science demand.
- Revenue grew 6% YoY; adjusted EBIT margin expanded 190 bps to 12.4%; adjusted EPS was $0.89 (up ~40%); organic sales +6%.
- Raised full-year guidance: adjusted EPS to ~$4.70 (≈25% growth), maintaining mid-single-digit organic sales growth and 100% free cash flow conversion.
- Launched new data center cooling platforms—YDAM (up to 3.5 MW), YK-HT (widest operating range)—and the Smart Ready Chiller for enhanced insights and service capabilities.
- Organic revenue grew 6%, orders increased nearly 40%, adjusted EBIT margin expanded 190 bps to 12.4%, and adjusted EPS of $0.89; backlog reached $18 billion, up 20%
- Raised full-year adjusted EPS guidance to $4.70 (≈25% growth), with mid-single digit organic sales growth, ~50% operating leverage, and ~100% free cash flow conversion
- Record backlog driven by data center projects and strong life sciences orders; regional orders: Americas +56%, EMEA +8%, APAC +10%
- Launched new data-center cooling solutions: YDAM chiller (3.5 MW, +20% capacity density), YK-HT chiller (broad operating range, saves up to 9 M gallons of water/year), and Smart Ready Chiller service platform
- Appointed Susan Hughes as APAC president to enhance regional execution and business system rollout
Quarterly earnings call transcripts for Johnson Controls International.
Ask Fintool AI Agent
Get instant answers from SEC filings, earnings calls & more