Earnings summaries and quarterly performance for BERKLEY W R.
Executive leadership at BERKLEY W R.
W. Robert Berkley, Jr.
President and Chief Executive Officer
William R. Berkley
Executive Chairman
James G. Shiel
Executive Vice President — Investments
Lucille T. Sgaglione
Executive Vice President
Philip S. Welt
Executive Vice President — Secretary
Richard M. Baio
Executive Vice President — Chief Financial Officer
Board of directors at BERKLEY W R.
Research analysts who have asked questions during BERKLEY W R earnings calls.
Andrew Kligerman
TD Cowen
9 questions for WRB
Brian Meredith
UBS
9 questions for WRB
David Motemaden
Evercore ISI
9 questions for WRB
Elyse Greenspan
Wells Fargo
9 questions for WRB
Alex Scott
Barclays PLC
8 questions for WRB
Meyer Shields
Keefe, Bruyette & Woods
8 questions for WRB
Mark Hughes
Truist Securities
7 questions for WRB
Michael Zaremski
BMO Capital Markets
7 questions for WRB
Ryan Tunis
Cantor Fitzgerald
7 questions for WRB
Josh Shanker
Bank of America
6 questions for WRB
Andrew Andersen
Jefferies
5 questions for WRB
Wesley Carmichael
Autonomous Research
5 questions for WRB
Rob Cox
Goldman Sachs
4 questions for WRB
Robert Cox
The Goldman Sachs Group, Inc.
4 questions for WRB
Tracy Benguigui
Wolfe Research
4 questions for WRB
Jian Huang
Morgan Stanley
3 questions for WRB
Joshua Shanker
Bank of America Merrill Lynch
3 questions for WRB
Katie Sakys
Autonomous Research
3 questions for WRB
Yaron Kinar
Oppenheimer & Co. Inc.
3 questions for WRB
Bob Huang
Morgan Stanley
2 questions for WRB
James Inglis
Philo Smith & Co.
2 questions for WRB
Maxwell Fritscher
Truist Financial Corporation
2 questions for WRB
Mike Zaremski
BMO Capital Markets
2 questions for WRB
Recent press releases and 8-K filings for WRB.
- Management expects normalized long-term growth of ~10% but acknowledges near-term growth may be in low single digits due to rapid market softening.
- Operates 60 businesses with dynamic cycle management, shrinking or expanding lines (e.g., commercial auto) based on rate adequacy to optimize risk-adjusted returns.
- Investment strategy shifts new allocations into fixed income (AA- quality, ~3-year duration), yielding high-teens returns; alternatives remain opportunistic.
- Generates ~$2 billion in annual capital, returning excess via share buybacks and dividends; MSI’s stake capped at 17.5%, with mechanisms for surplus shares.
- Continues to calibrate rate increases amid ongoing, non-stationary social inflation trends, varying by state and product line.
- Normalized growth target of around 10% amid current low-single-digit premium increases; recent market softening has accelerated faster than anticipated, creating both headwinds and future opportunities.
- Portfolio now spans 60 distinct businesses (vs. ~30 in 2006), allowing decoupled product-line performance—some segments grow while others shrink—to stabilize top-line results through the insurance cycle.
- Generating roughly $2 billion of excess capital annually; excess is returned via regular and special dividends and share buybacks. MSI’s stake is capped at 17.5%, with automatic disposal mechanisms if exceeded.
- Investment strategy has shifted new allocations into high-quality fixed income (avg. credit ~AA–, duration ~3 years), yielding high-teens to low-20s returns; firm remains opportunistic on duration but maintains strict credit quality.
- Social inflation continues to trend upward, with significant rate adequacy actions in auto liability and medical professional lines; rate calibrations vary by state and product complexity.
- Identified market decoupling: property markets facing rate erosion, while casualty markets remain disciplined; Berkley is favorably positioned given its liability line weighting.
- Projects premium growth in 2026, but at a slower pace than 2023–2025, and will underwrite selectively to optimize risk-adjusted returns, shrinking less attractive lines and expanding where pricing is adequate.
- Investing in AI to boost underwriting intake efficiency by roughly 30% and accelerate low-value claims processing, while proactively defining standalone policy terms and limits for AI exposures.
- Expanding distribution through direct-to-consumer, point-of-sale embedded insurance and digital channels, alongside traditional wholesale and retail partnerships, to meet evolving customer preferences.
- Maintains strong cash generation and surplus capital, returning excess via share buybacks and special dividends, and favors fixed-income investments with new-money yields above the portfolio book yield.
- Focus on operational excellence and future positioning to capture shifts in client risk and drive disciplined, risk-adjusted returns rather than premium growth targets.
- Notes decoupled pricing cycles across lines: property rates are softening while casualty remains firm, leading to an expected flattish premium growth in 2026, slower than 2023–25.
- Investing in AI to increase underwriting intake efficiency by ~30% and enable near–straight-through processing for small claims, with measurable benefits beginning in 2027 under a centralized governance model.
- Generating surplus capital faster than deployment needs, returning excess via opportunistic share repurchases and special dividends while maintaining conservative leverage.
- Expanding distribution through direct-to-consumer, embedded point-of-sale solutions and traditional wholesale/retail channels to meet evolving customer preferences.
- W. R. Berkley notes mixed P&C pricing cycles, with property rates softening and casualty rates firming, aligning well with its liability-focused portfolio.
- Plans for modest premium growth in 2026, slower than 2023–25, by shrinking unprofitable lines and expanding where risk-adjusted returns are attractive.
- Investing in AI-driven data and technology, boosting underwriting intake efficiency by ~30% and exploring straight-through claims processing for small losses.
- Maintains an appropriate capital cushion, returning excess via special dividends and share buybacks to optimize shareholder value.
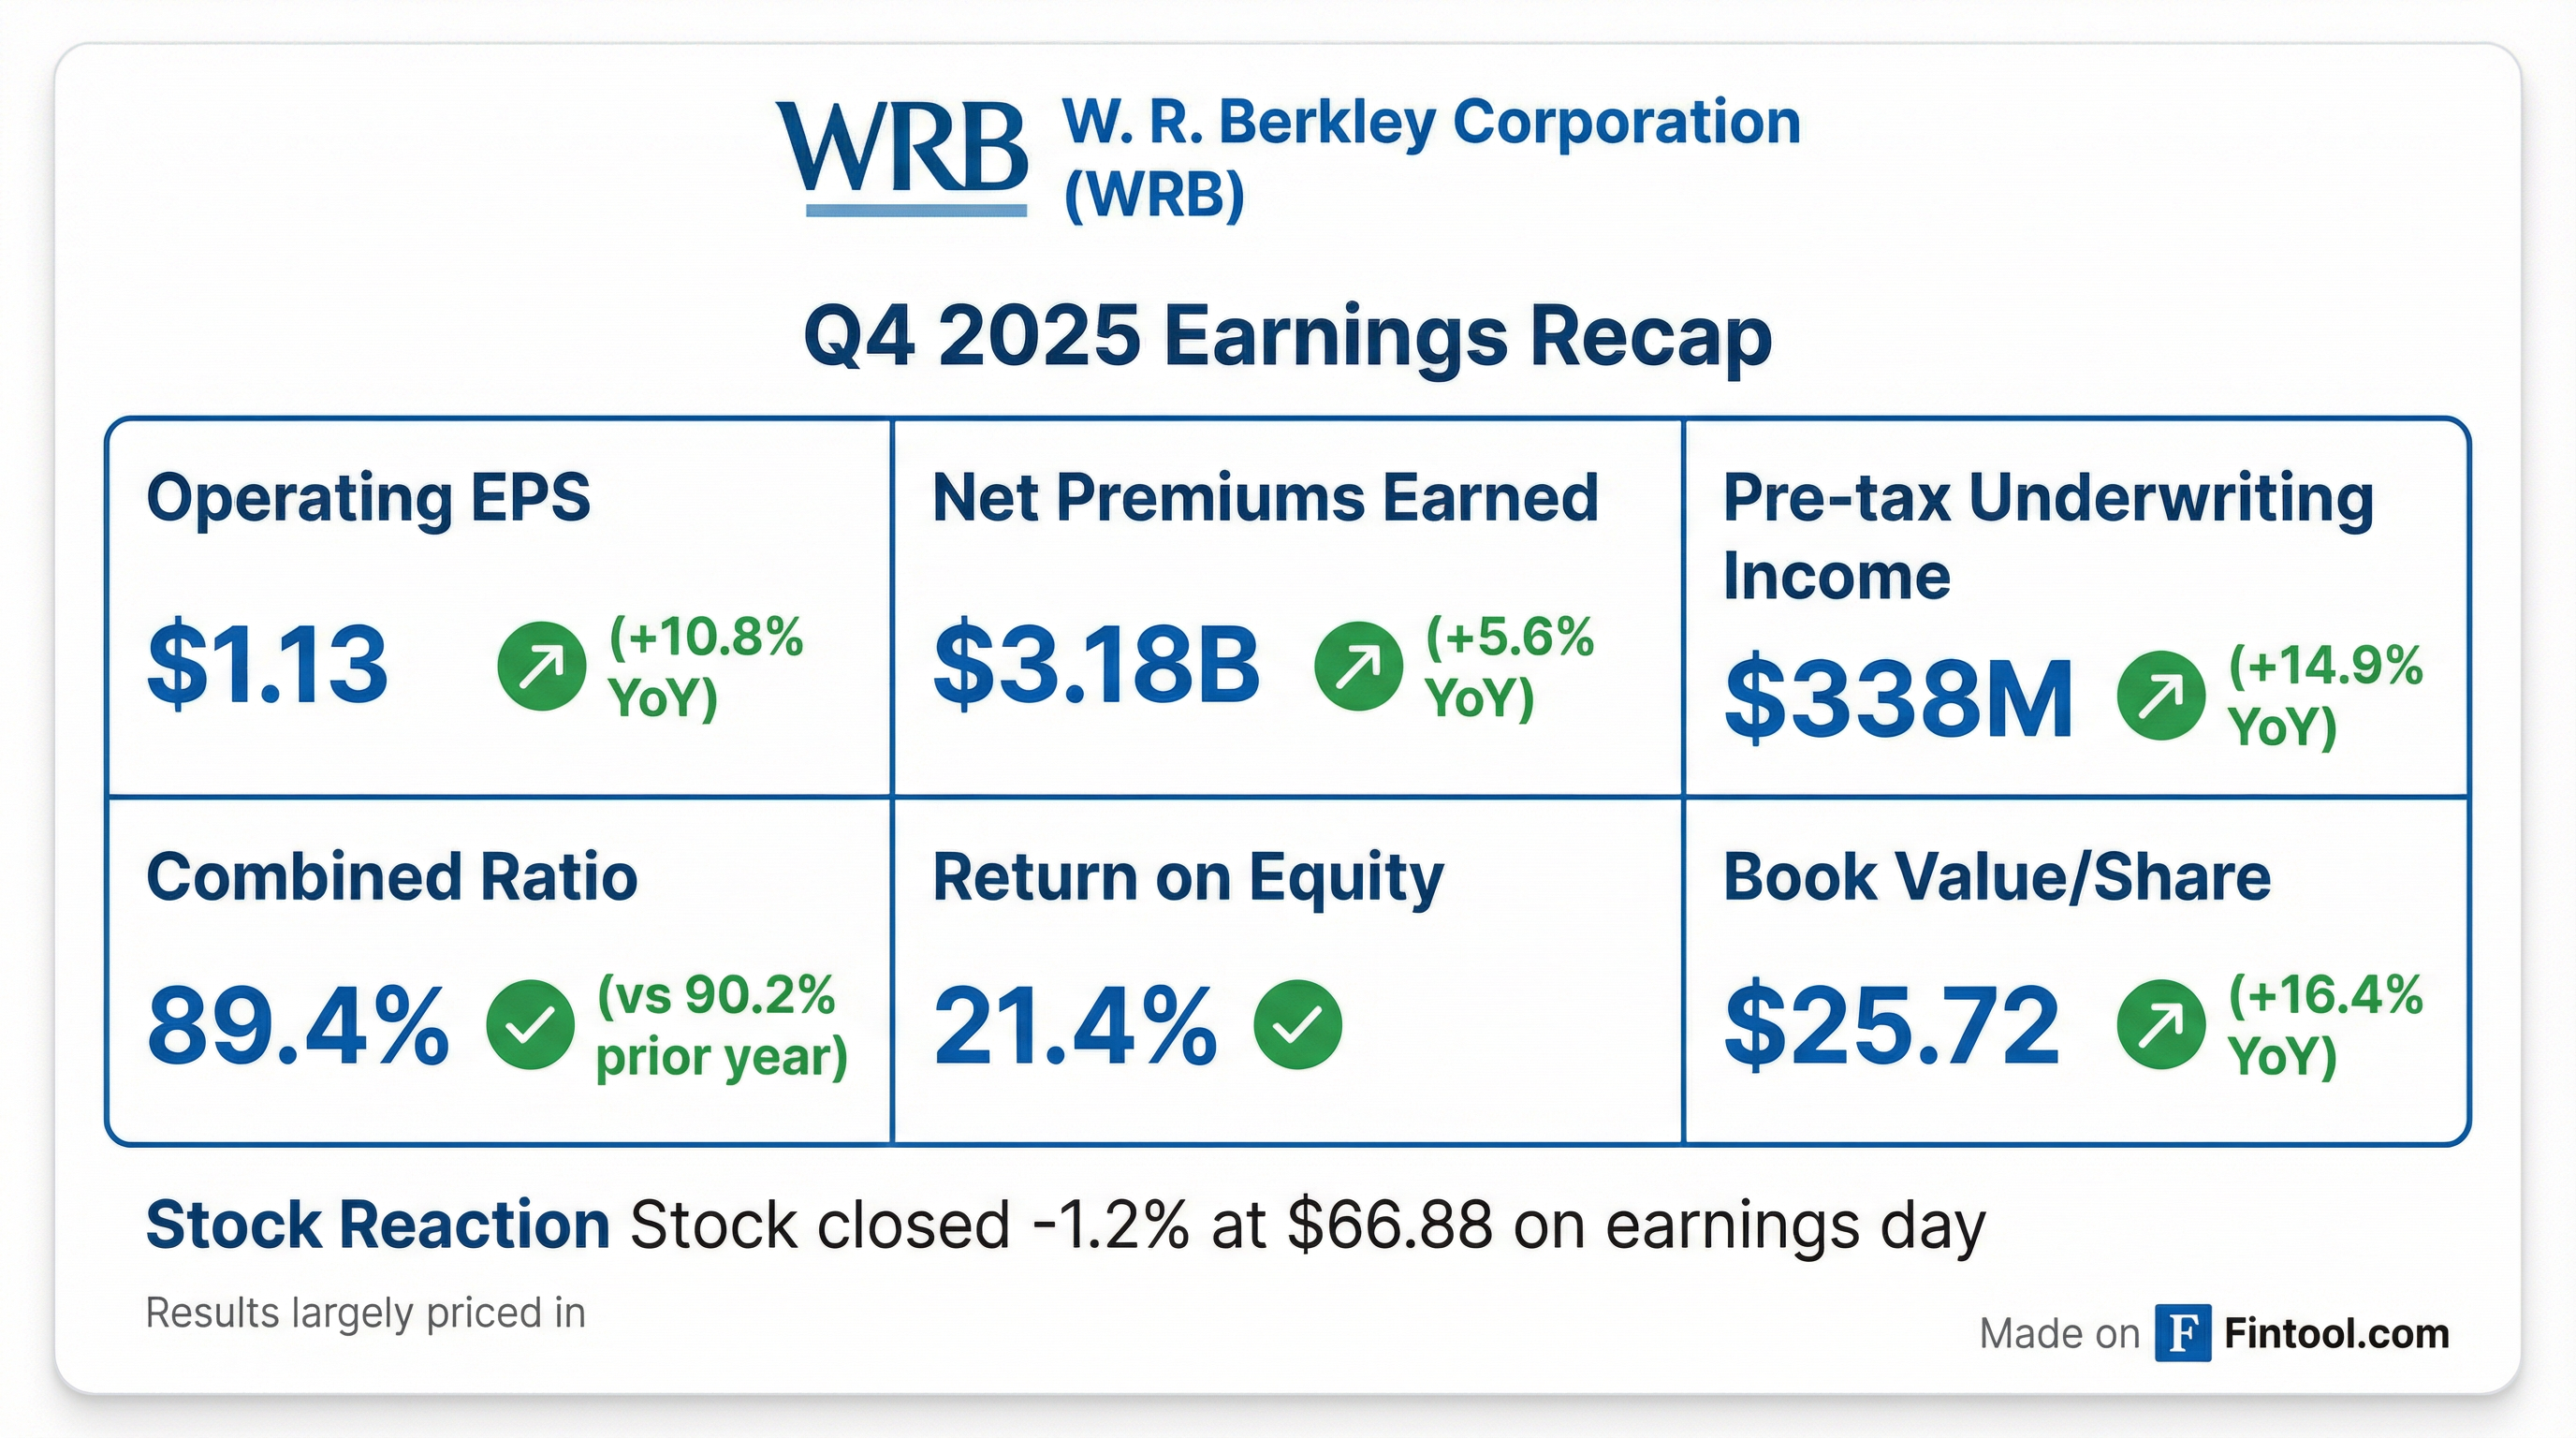
- Record Q4 operating earnings of $450 million ($1.13 per share) and pre-tax underwriting income of $338 million, up 14.9% year-over-year, driving a 21.4% return on beginning-of-year equity.
- Underwriting strength reflected in an expense ratio of 28.2% (on net premiums earned of $3.2 billion) and a calendar year combined ratio of 89.4%.
- Invested assets grew 11.4% to $33.2 billion, with fixed maturity income up 13.3% to $346 million, leading to pre-tax net investment income of $338 million after fund losses.
- Returned $608 million of capital in Q4 (dividends of $412 million; share repurchases of $196 million) and $971 million for full 2025, while reducing financial leverage to 22.6%.
- For full year 2025, gross and net premiums written were $15.1 billion and $12.7 billion, respectively; underwriting income was $1.2 billion; net investment income $1.4 billion; operating income $1.7 billion; net income $1.8 billion; and book value per share rose 26.7% before and 16.4% after capital returns.
- Record quarterly operating earnings of $450 million (EPS $1.13), up 9.5% YoY, with a 21.4% return on beginning equity
- Record pre-tax underwriting income of $338 million on net premiums earned of $3.2 billion, delivering a current accident year combined ratio ex-cats of 87.9% and calendar-year combined ratio of 89.4%
- Net investment income of $338 million, with fixed maturity income up 13.3% to $346 million, portfolio rated AA- and duration extended to 3 years
- Returned $608 million of capital in Q4 (dividends $412 million, buybacks $196 million) and $971 million in 2025; financial leverage at 22.6%, book value per share up 26.7% pre-dividends
- Guidance for 2026: expense ratio to stay below 30%, effective tax rate ~23%, and significant tech/AI investments expected to yield benefits starting 2027
- WR Berkley delivered Q4 operating earnings of $450 million ($1.13/share), up 9.5% YoY, with a 21.4% ROE.
- Q4 underwriting income reached $338 million pre-tax (+14.9%) on net premiums earned of $3.2 billion, with an expense ratio of 28.2% and a current accident year combined ratio ex-cats of 87.9%.
- Invested assets grew 11.4% to $33.2 billion, producing Q4 net investment income (pre-tax) of $338 million; portfolio rated AA- with a duration of 3 years.
- Full-year 2025 highlights: gross/net premiums written of $15.1 billion/$12.7 billion, underwriting income $1.2 billion, net investment income $1.4 billion, operating income $1.7 billion, net income $1.8 billion, and book value per share growth of 26.7% before and 16.4% after capital returns.
- Returned $971 million of capital in 2025 through dividends and share repurchases; financial leverage at 22.6%; 2026 expense ratio expected <30%, tax rate ~23%.
- Q4 net income to common stockholders was $449.5 million (diluted EPS $1.13), and full-year net income was $1.78 billion (diluted EPS $4.45).
- Return on equity stood at 21.4% for Q4 and 21.2% for the full year.
- Record annual pre-tax underwriting income reached $1.2 billion, and net investment income grew to $1.4 billion.
- Book value per share increased 5.2% in Q4 and 26.7% for the year, before dividends and share repurchases.
- Total capital returned in Q4 was $608.3 million (including $377.9 million special dividends, $196.4 million share buybacks and $34.0 million regular dividends); full-year returns totaled $970.5 million.
- Q4 return on equity of 21.4%, contributing to a 21.2% ROE for the full year 2025.
- Record annual pre-tax underwriting income of $1.2 billion and net investment income of $1.4 billion, with net income to common of $1.78 billion.
- Full year gross premiums written grew to $15.1 billion and net premiums written to $12.7 billion, both all-time highs.
- Strong underwriting performance with a GAAP combined ratio of 89.4% in Q4 and 90.7% for the year.
- Returned $608 million to shareholders in Q4 (including $377.9 million special dividends and $196.4 million share repurchases) and $970.5 million for the full year.
Fintool News
In-depth analysis and coverage of BERKLEY W R.

Quarterly earnings call transcripts for BERKLEY W R.
Ask Fintool AI Agent
Get instant answers from SEC filings, earnings calls & more