Earnings summaries and quarterly performance for BERKLEY W R.
Executive leadership at BERKLEY W R.
W. Robert Berkley, Jr.
President and Chief Executive Officer
William R. Berkley
Executive Chairman
James G. Shiel
Executive Vice President — Investments
Lucille T. Sgaglione
Executive Vice President
Philip S. Welt
Executive Vice President — Secretary
Richard M. Baio
Executive Vice President — Chief Financial Officer
Board of directors at BERKLEY W R.
Research analysts who have asked questions during BERKLEY W R earnings calls.
Andrew Kligerman
TD Cowen
9 questions for WRB
Brian Meredith
UBS
9 questions for WRB
David Motemaden
Evercore ISI
9 questions for WRB
Elyse Greenspan
Wells Fargo
9 questions for WRB
Alex Scott
Barclays PLC
8 questions for WRB
Meyer Shields
Keefe, Bruyette & Woods
8 questions for WRB
Mark Hughes
Truist Securities
7 questions for WRB
Michael Zaremski
BMO Capital Markets
7 questions for WRB
Ryan Tunis
Cantor Fitzgerald
7 questions for WRB
Josh Shanker
Bank of America
6 questions for WRB
Andrew Andersen
Jefferies
5 questions for WRB
Wesley Carmichael
Autonomous Research
5 questions for WRB
Rob Cox
Goldman Sachs
4 questions for WRB
Robert Cox
The Goldman Sachs Group, Inc.
4 questions for WRB
Tracy Benguigui
Wolfe Research
4 questions for WRB
Jian Huang
Morgan Stanley
3 questions for WRB
Joshua Shanker
Bank of America Merrill Lynch
3 questions for WRB
Katie Sakys
Autonomous Research
3 questions for WRB
Yaron Kinar
Oppenheimer & Co. Inc.
3 questions for WRB
Bob Huang
Morgan Stanley
2 questions for WRB
James Inglis
Philo Smith & Co.
2 questions for WRB
Maxwell Fritscher
Truist Financial Corporation
2 questions for WRB
Mike Zaremski
BMO Capital Markets
2 questions for WRB
Recent press releases and 8-K filings for WRB.
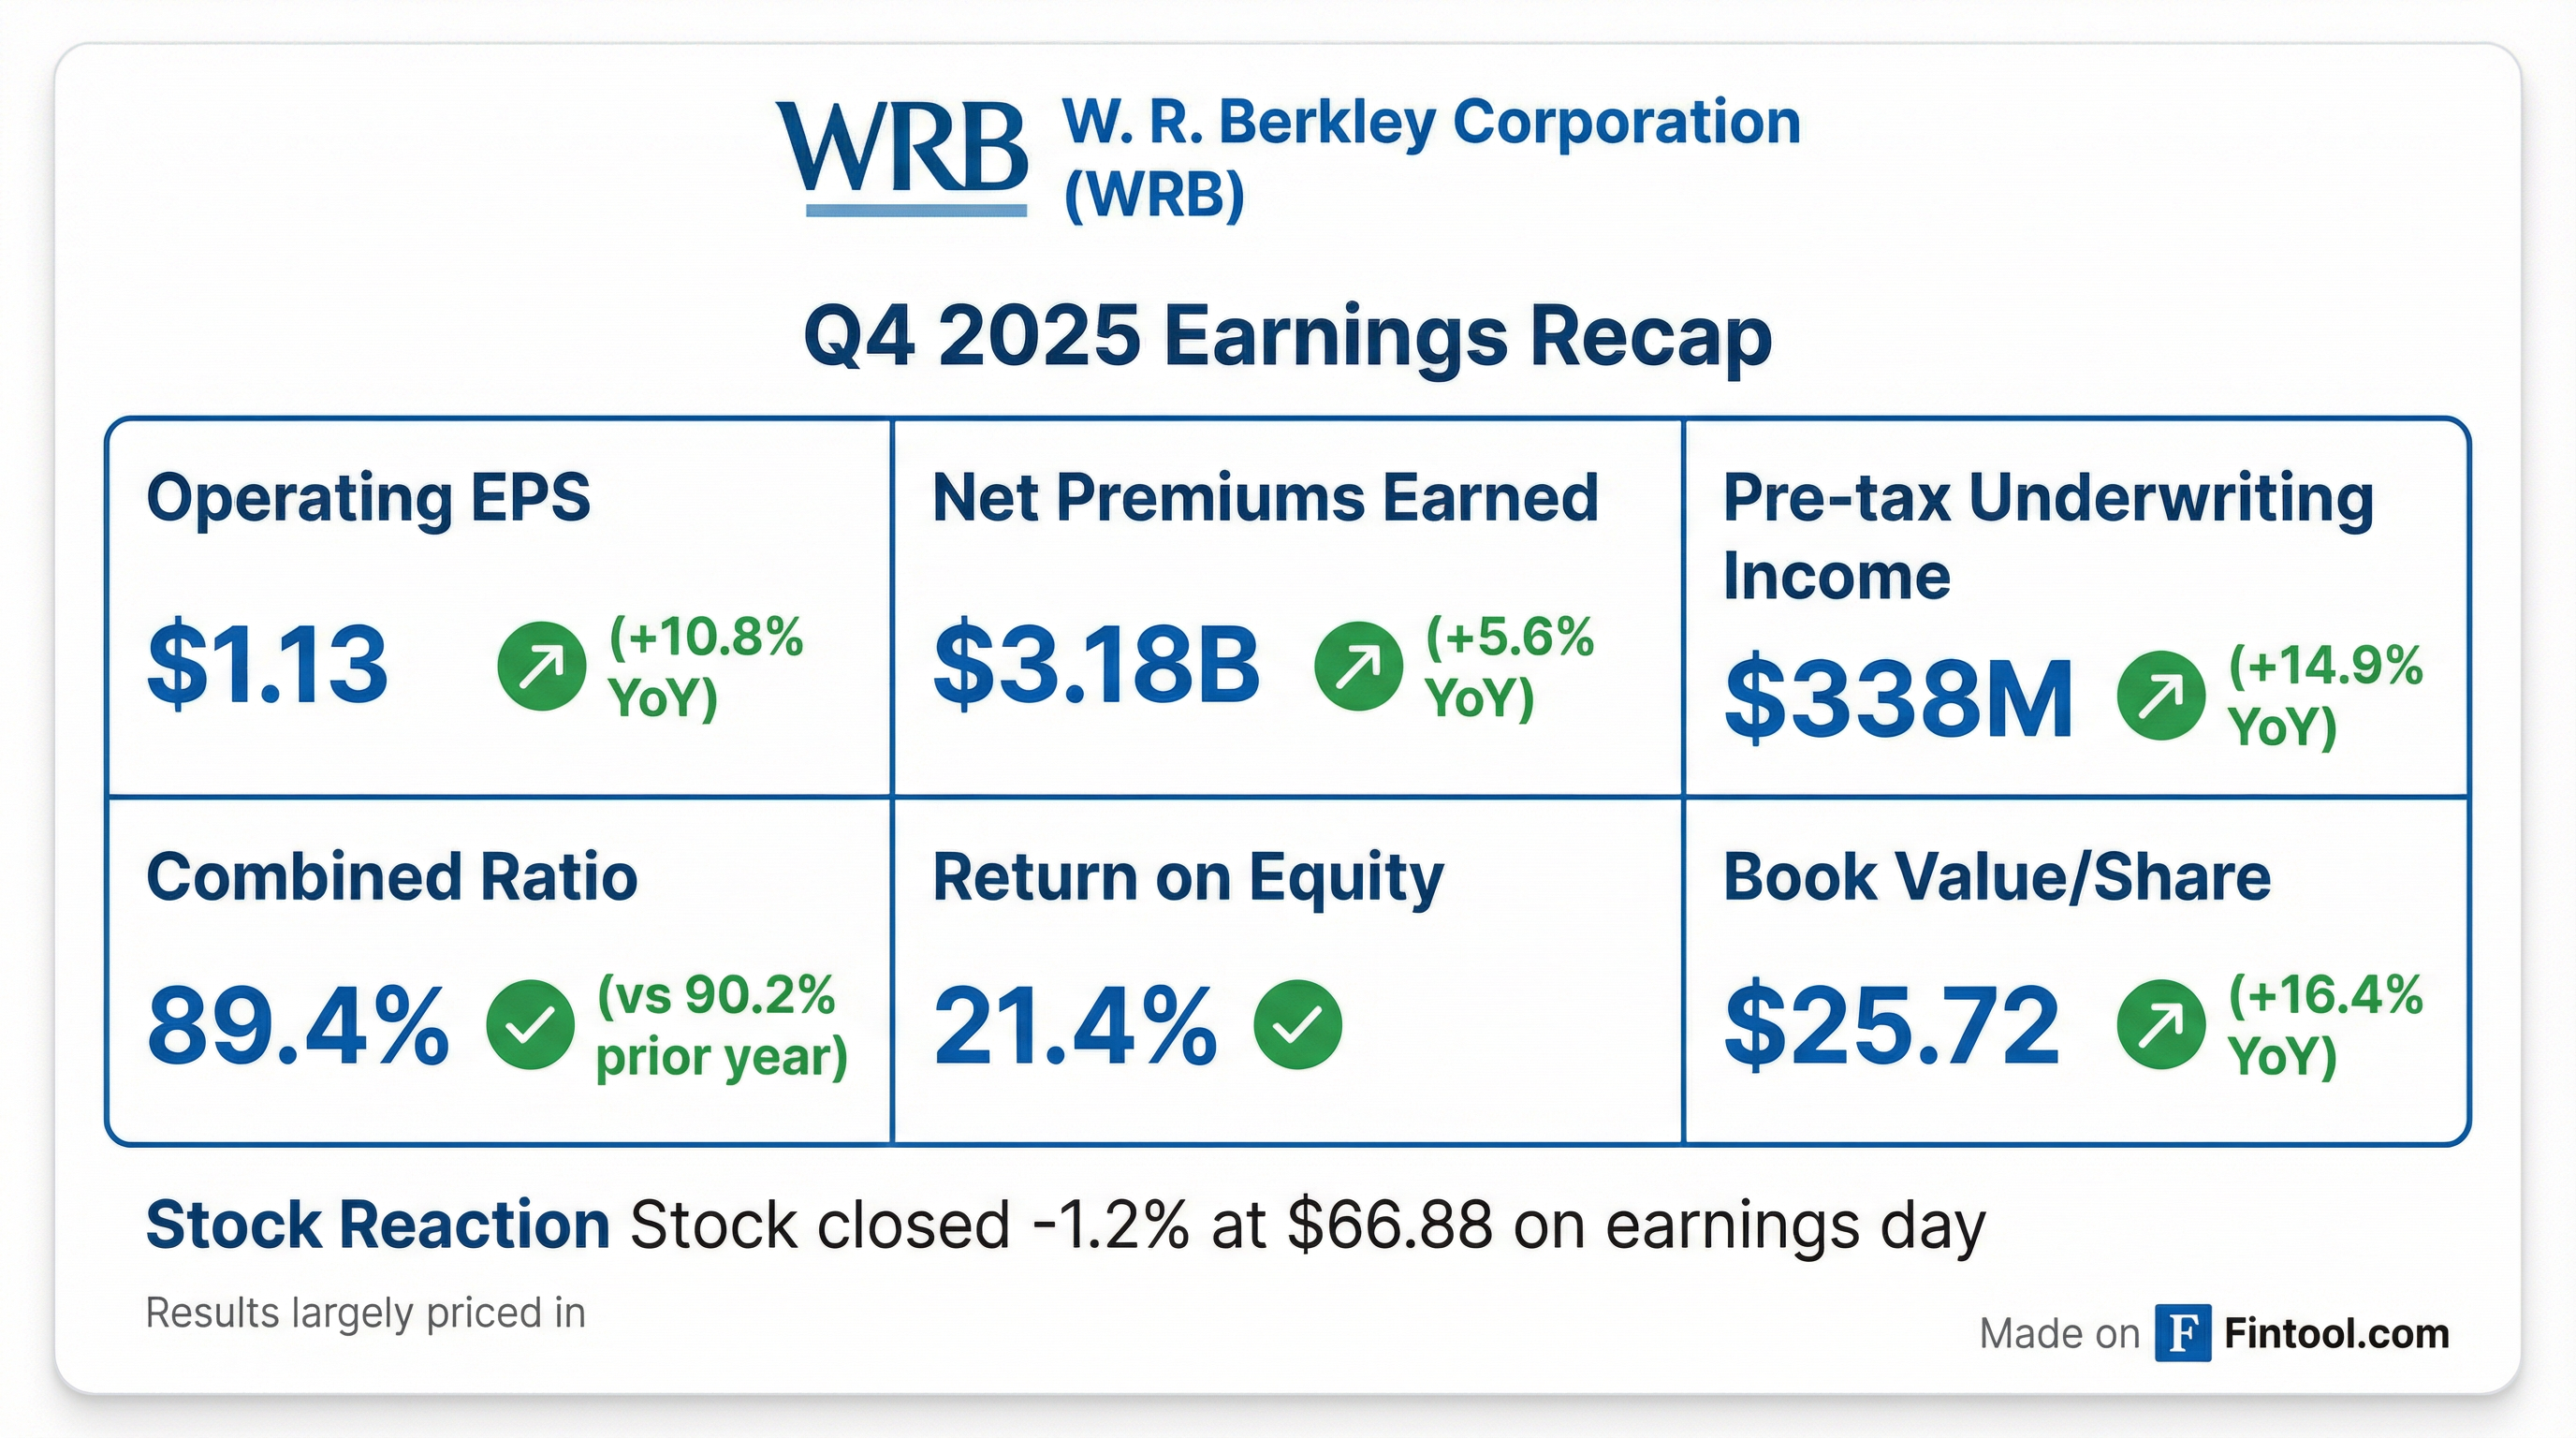
- Record Q4 operating earnings of $450 million ($1.13 per share) and pre-tax underwriting income of $338 million, up 14.9% year-over-year, driving a 21.4% return on beginning-of-year equity.
- Underwriting strength reflected in an expense ratio of 28.2% (on net premiums earned of $3.2 billion) and a calendar year combined ratio of 89.4%.
- Invested assets grew 11.4% to $33.2 billion, with fixed maturity income up 13.3% to $346 million, leading to pre-tax net investment income of $338 million after fund losses.
- Returned $608 million of capital in Q4 (dividends of $412 million; share repurchases of $196 million) and $971 million for full 2025, while reducing financial leverage to 22.6%.
- For full year 2025, gross and net premiums written were $15.1 billion and $12.7 billion, respectively; underwriting income was $1.2 billion; net investment income $1.4 billion; operating income $1.7 billion; net income $1.8 billion; and book value per share rose 26.7% before and 16.4% after capital returns.
- Record quarterly operating earnings of $450 million (EPS $1.13), up 9.5% YoY, with a 21.4% return on beginning equity
- Record pre-tax underwriting income of $338 million on net premiums earned of $3.2 billion, delivering a current accident year combined ratio ex-cats of 87.9% and calendar-year combined ratio of 89.4%
- Net investment income of $338 million, with fixed maturity income up 13.3% to $346 million, portfolio rated AA- and duration extended to 3 years
- Returned $608 million of capital in Q4 (dividends $412 million, buybacks $196 million) and $971 million in 2025; financial leverage at 22.6%, book value per share up 26.7% pre-dividends
- Guidance for 2026: expense ratio to stay below 30%, effective tax rate ~23%, and significant tech/AI investments expected to yield benefits starting 2027
- WR Berkley delivered Q4 operating earnings of $450 million ($1.13/share), up 9.5% YoY, with a 21.4% ROE.
- Q4 underwriting income reached $338 million pre-tax (+14.9%) on net premiums earned of $3.2 billion, with an expense ratio of 28.2% and a current accident year combined ratio ex-cats of 87.9%.
- Invested assets grew 11.4% to $33.2 billion, producing Q4 net investment income (pre-tax) of $338 million; portfolio rated AA- with a duration of 3 years.
- Full-year 2025 highlights: gross/net premiums written of $15.1 billion/$12.7 billion, underwriting income $1.2 billion, net investment income $1.4 billion, operating income $1.7 billion, net income $1.8 billion, and book value per share growth of 26.7% before and 16.4% after capital returns.
- Returned $971 million of capital in 2025 through dividends and share repurchases; financial leverage at 22.6%; 2026 expense ratio expected <30%, tax rate ~23%.
- Q4 net income to common stockholders was $449.5 million (diluted EPS $1.13), and full-year net income was $1.78 billion (diluted EPS $4.45).
- Return on equity stood at 21.4% for Q4 and 21.2% for the full year.
- Record annual pre-tax underwriting income reached $1.2 billion, and net investment income grew to $1.4 billion.
- Book value per share increased 5.2% in Q4 and 26.7% for the year, before dividends and share repurchases.
- Total capital returned in Q4 was $608.3 million (including $377.9 million special dividends, $196.4 million share buybacks and $34.0 million regular dividends); full-year returns totaled $970.5 million.
- Q4 return on equity of 21.4%, contributing to a 21.2% ROE for the full year 2025.
- Record annual pre-tax underwriting income of $1.2 billion and net investment income of $1.4 billion, with net income to common of $1.78 billion.
- Full year gross premiums written grew to $15.1 billion and net premiums written to $12.7 billion, both all-time highs.
- Strong underwriting performance with a GAAP combined ratio of 89.4% in Q4 and 90.7% for the year.
- Returned $608 million to shareholders in Q4 (including $377.9 million special dividends and $196.4 million share repurchases) and $970.5 million for the full year.
- The Board of Directors has raised the share repurchase authorization to 25 million shares of common stock.
- The company emphasizes delivering shareholder value through book value growth and capital returns.
- Repurchases may be executed in the open market or via privately negotiated transactions, subject to market conditions and other factors.
- MSI is acquiring a 15% stake in W.R. Berkley through a purchase of existing shares, with no new shares issued and management retaining their holdings.
- The company remains focused on specialty insurance via 60 independently managed underwriting units, targeting risk-adjusted returns and disciplined underwriting discipline.
- Insurance-cycle commentary: product lines are now decoupled—commercial property is softening, while casualty lines are firming as insurers catch up with loss-cost and social inflation trends.
- Capital deployment: W.R. Berkley expects to sustain high-teens ROE and will return excess capital through share buybacks and special dividends, while maintaining a cautious approach to M&A.
- MSI, a major Japanese insurer, is acquiring a 12.5%–15% stake in W.R. Berkley with no new shares issued and no insider sell-down.
- The company operates 60 independently managed underwriting units, each focused on specialized niche products to drive risk-adjusted returns.
- Market dynamics show a decoupling of product lines, with property softening and liability firming; casualty loss trends remain elevated due to economic and social inflation, prompting continued rate increases.
- Capital allocation priorities include organic growth, share repurchases, and special dividends; management remains cautious on M&A, favoring in-house builds over acquisitions.
- W.R. Berkley expects to sustain high-teens ROE, balancing underwriting discipline with net investment income from new money yields above the book yield.
- On December 5, 2025, W. R. Berkley Corporation announced that Mitsui Sumitomo Insurance Co. acquired beneficial ownership of at least 12.5% of its common stock under agreements with the Berkley family.
- MSI’s shares were not purchased from the Company or the Berkley family and will be voted per the Berkley Family’s recommendations, except in limited circumstances where they vote proportionally with all other non-MSI shares.
- MSI expects to complete its investment in Q1 2026 under the existing agreements.
- Third quarter net income was $511 million or $1.28 per share, delivering a 24.3% return on beginning-of-year equity (operating ROE 21%) and underwriting pre-tax income up 8.2% to $287 million, with a combined ratio of 90.9% (ex-cats 88.4%)
- Record net premiums earned exceeded $3.2 billion and net premiums written totaled $3.8 billion, supporting an expense ratio of 28.5% and current accident year loss ratio ex-cats of 59.9%
- Net investment income grew 9.4% to $351 million, while fixed maturities yielded 4.8% with a duration of 2.9 years; liquidity stood at $2.4 billion
- Stockholders’ equity reached $9.8 billion, up 16.7% YTD; YTD capital returned was $362 million via dividends and share repurchases; book value per share grew 20.7% YTD and financial leverage fell to 22.5%
- Management noted ongoing industry cyclicality with pressure on property CAT pricing, emphasizing specialty and small-account underwriting plus selective growth in homeowners (Berkley One) and accident & health
Fintool News
In-depth analysis and coverage of BERKLEY W R.

Quarterly earnings call transcripts for BERKLEY W R.
Ask Fintool AI Agent
Get instant answers from SEC filings, earnings calls & more