Earnings summaries and quarterly performance for AVALONBAY COMMUNITIES.
Executive leadership at AVALONBAY COMMUNITIES.
Board of directors at AVALONBAY COMMUNITIES.
Charles Mueller Jr.
Director
Christopher Howard
Director
Conor Flynn
Director
Glyn Aeppel
Director
Nnenna Lynch
Director
Richard Lieb
Director
Ronald Havner Jr.
Director
Stephen Hills
Director
Susan Swanezy
Director
Terry Brown
Lead Independent Director
Timothy Naughton
Chairman of the Board
Research analysts who have asked questions during AVALONBAY COMMUNITIES earnings calls.
Alexander Goldfarb
Piper Sandler
8 questions for AVB
Austin Wurschmidt
KeyBanc Capital Markets Inc.
7 questions for AVB
John Kim
BMO Capital Markets
7 questions for AVB
Rich Hightower
Barclays
7 questions for AVB
Steve Sakwa
Evercore ISI
7 questions for AVB
Adam Kramer
Morgan Stanley
6 questions for AVB
Eric Wolfe
Citi
5 questions for AVB
John Pawlowski
Green Street
5 questions for AVB
Alex Kim
Zelman & Associates
4 questions for AVB
Haendel St. Juste
Mizuho Financial Group
4 questions for AVB
Michael Goldsmith
UBS
4 questions for AVB
Jamie Feldman
Wells Fargo & Company
3 questions for AVB
Nick Joseph
Citigroup Inc.
3 questions for AVB
Alex Kalmus
Zelman & Associates
2 questions for AVB
Ami Probandt
UBS
2 questions for AVB
Anthony Paolone
JPMorgan Chase & Co.
2 questions for AVB
James Feldman
Wells Fargo
2 questions for AVB
Jana Galan
Bank of America
2 questions for AVB
Jana Gallen
Bank of America
2 questions for AVB
Jeffrey Spector
BofA Securities
2 questions for AVB
Linda Tsai
Jefferies
2 questions for AVB
Nicholas Yulico
Scotiabank
2 questions for AVB
Nick Yulico
Scotiabank
2 questions for AVB
Omotayo Okusanya
Deutsche Bank AG
2 questions for AVB
Richard Anderson
Wedbush Securities
2 questions for AVB
Alexander Kim
Zelman & Associates
1 question for AVB
Amy
UBS
1 question for AVB
Amy Yi Li
UBS
1 question for AVB
Ann Chan
Green Street
1 question for AVB
Austin Worschmidt
KeyBank Capital Markets
1 question for AVB
Brad Heffern
RBC Capital Markets
1 question for AVB
Cooper Clark
Wells Fargo
1 question for AVB
Joshua Dennerlein
BofA Securities
1 question for AVB
Michael Stefany
Mizuho Financial Group
1 question for AVB
Mike Coto
Mizuho Securities
1 question for AVB
Mike On
Mizuho Securities
1 question for AVB
Recent press releases and 8-K filings for AVB.
- 2.1% revenue growth in 2025 with a record-low 41% turnover and a mid-lease Net Promoter Score of 34, reflecting strong resident retention and satisfaction.
- Launched $1.65 billion of development at an initial yield of 6.2%, raised $2.4 billion of capital at a 5% cost, and repurchased $490 million of shares at an average price of $182.
- Guided 1.4% same-store revenue growth for 2026 with a 2% full-year effective rent increase, expecting low-1% growth in H1 and mid-2% in H2.
- Plans $800 million of new development starts at 6.5–7% yields, projecting $47 million of development NOI in 2026 and $75 million in 2027.
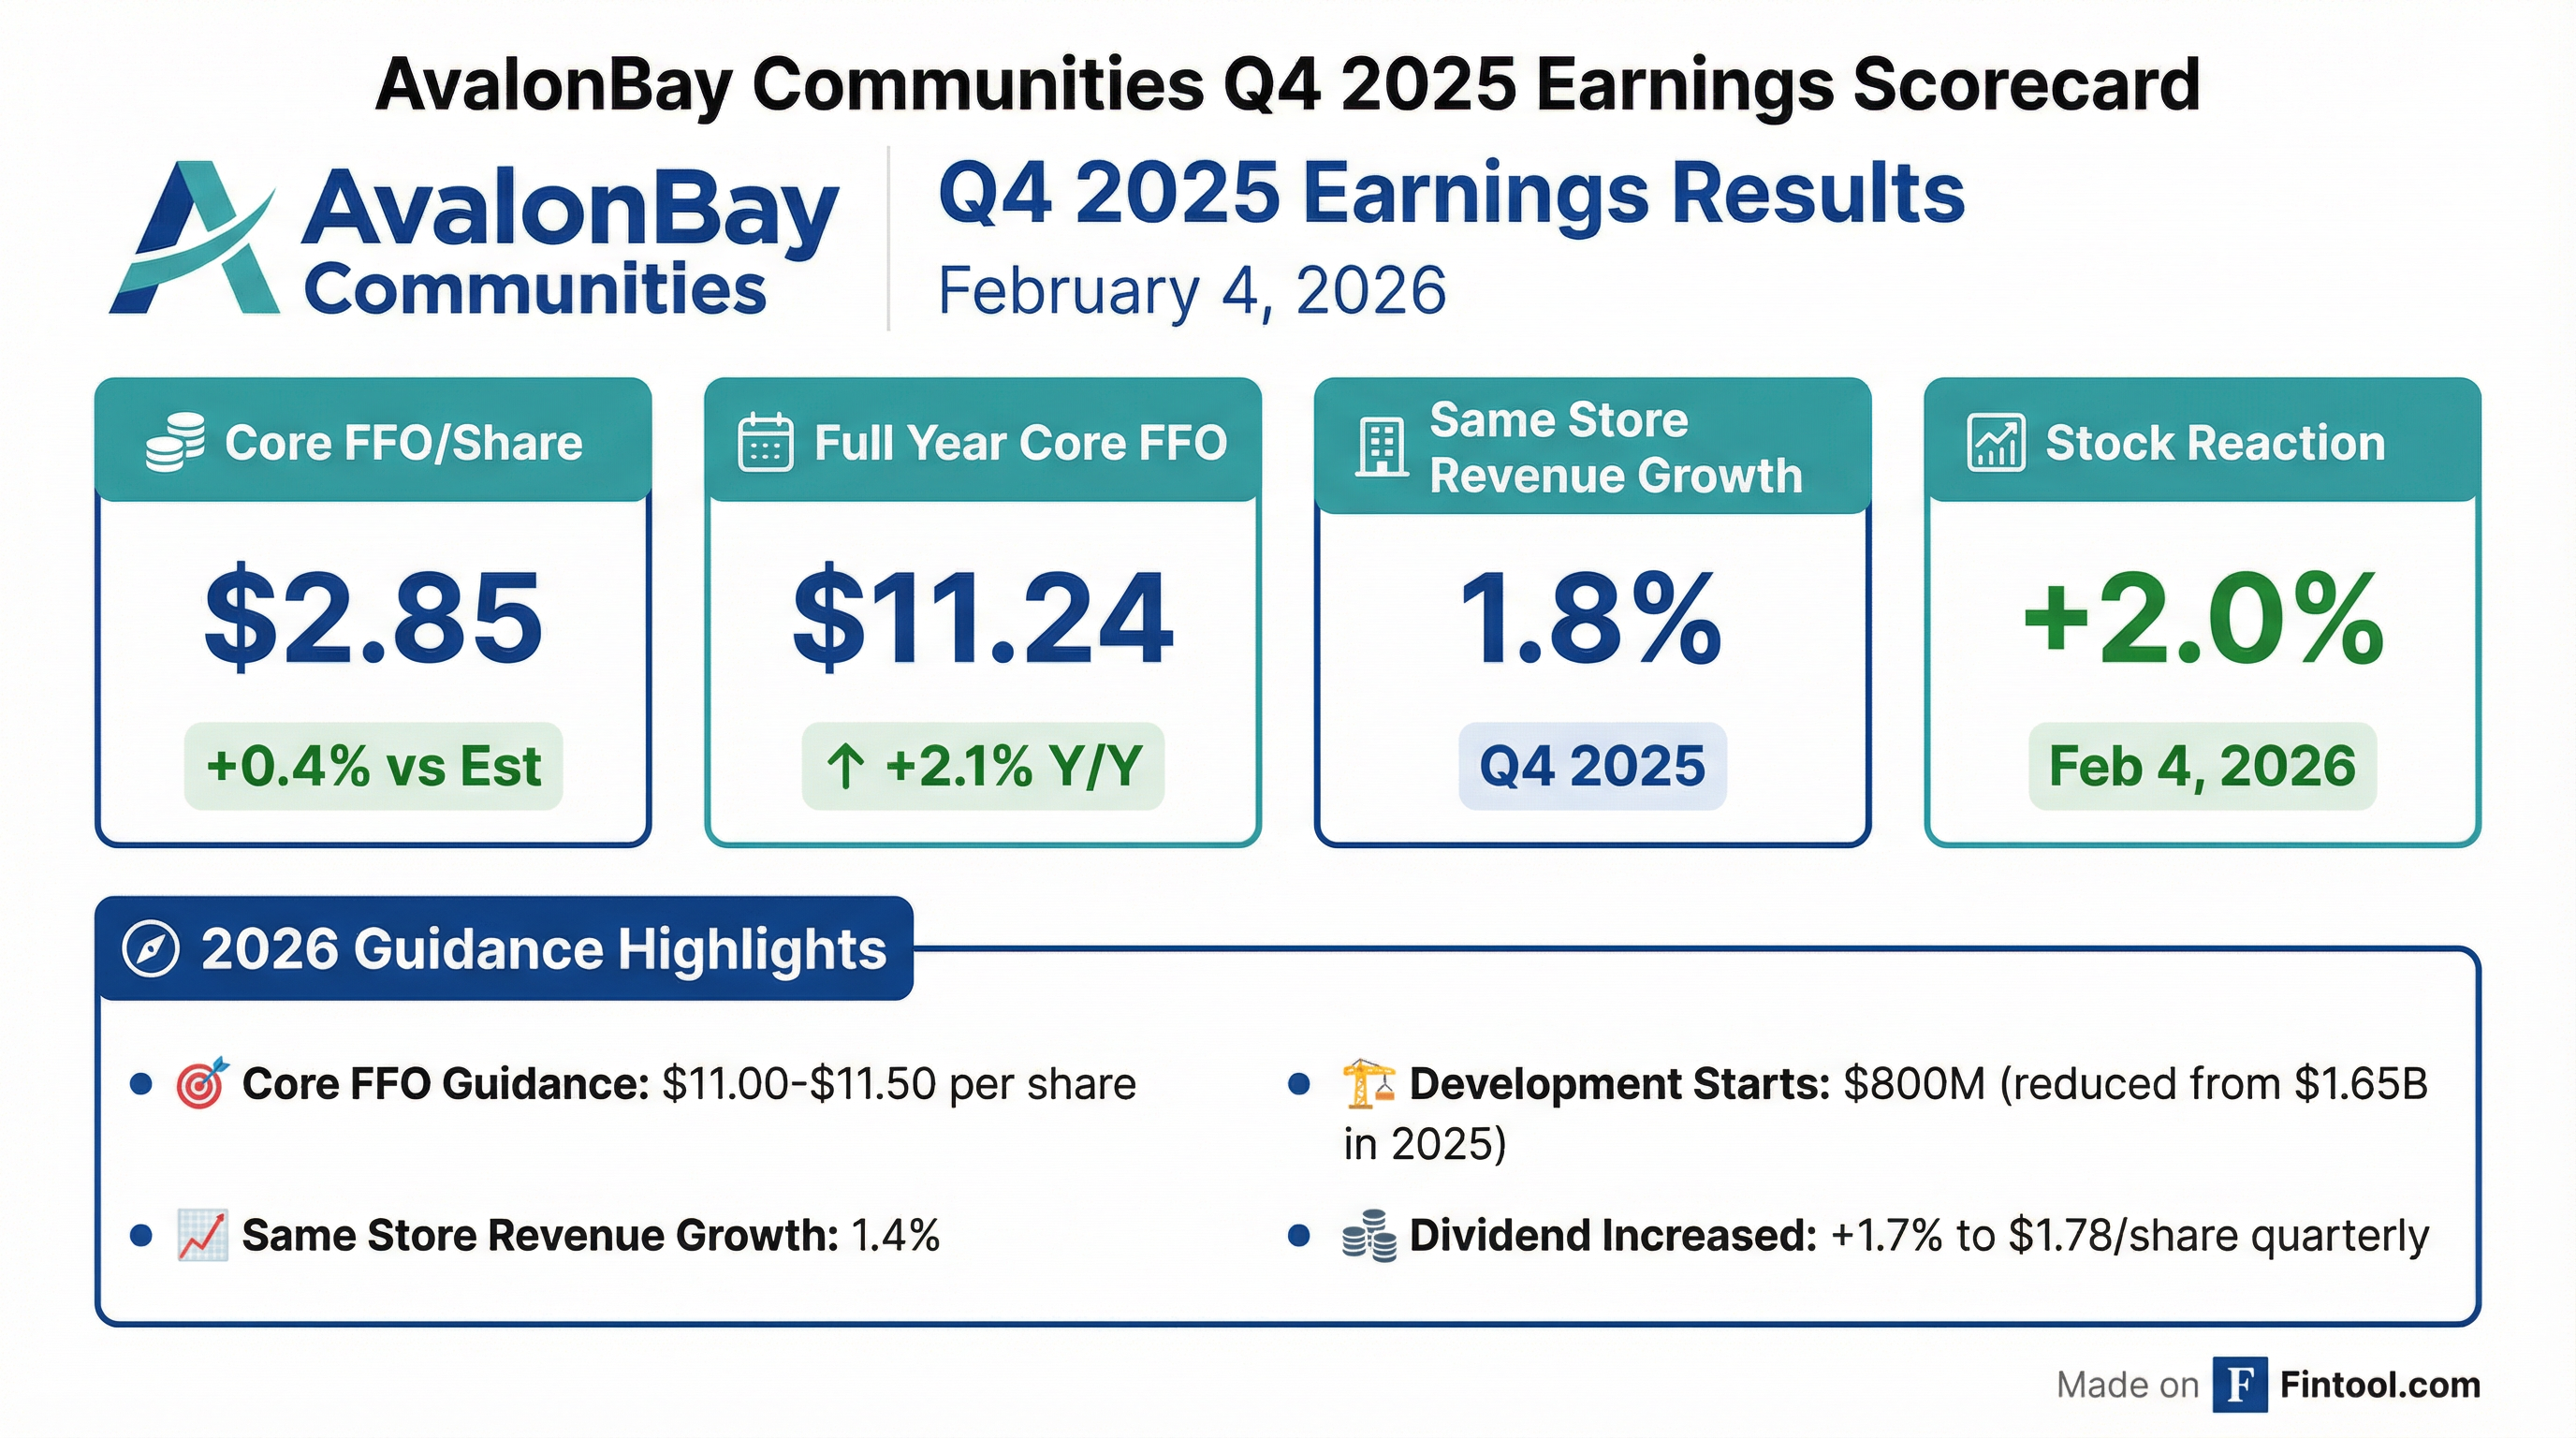
- Core FFO per share grew 1.8% in Q4 2025 and 2.1% for the full year 2025
- Same-store residential revenue increased 1.8% in Q4 2025 and 2.5% for full-year 2025
- Development starts totaled $590 M in Q4 and $1.65 B for 2025; completions were $290 M in Q4 and $560 M for the year
- Capital sourced of $480 M in Q4 and $2.5 B YTD; shares repurchased amounted to $336 M in Q4 and $488 M full-year
- Outlook: 2026 projected core FFO per share growth of 0.1% and same-store residential revenue growth of 1.4%; quarterly dividend raised ~1.7% to $1.78 per share
- Board approved a 1.7% dividend increase to $1.78 per share, maintaining a conservative payout ratio.
- 2026 guidance includes 1.4% same-store revenue growth, 2% full-year effective rent growth (H1 low 1%, H2 mid-2s), and 3.8% same-store OpEx growth.
- Core FFO per share drivers for 2026: + $0.04 from same-store NOI, + $0.10 from net development earnings, partially offset by refinancing and transaction headwinds.
- Development activity restrained to $800 million of new starts at 6.5–7% yields, with $47 million of development NOI expected in 2026 and an additional $75 million in 2027.
- In 2025, portfolio revenue grew by 2.1%, turnover hit a record low 41%, and mid-lease Net Promoter Score reached 34, reflecting strong resident retention and engagement.
- AvalonBay initiated $1.65 billion of development projects at an average initial stabilized yield of 6.2%, funded at ~5% cost, repurchased $490 million of shares at an average price of $182, and raised $2.4 billion of capital.
- For 2026, same-store revenue is guided to grow 1.4%, underpinned by a 2% like-term effective rent increase and modest job growth alongside declining supply.
- 2026 Core FFO per share is expected to reflect + $0.04 from same-store NOI, + $0.10 from development earnings, + $0.07 from structured investments and share repurchases, offset by – $0.17 from refinancing and transaction activity.
- AvalonBay delivered Q4 2025 diluted EPS of $1.17 (down 40.9% YoY), FFO per share of $2.80 (up 6.5%) and Core FFO per share of $2.85 (up 1.8%); full year 2025 EPS was $7.40 (−2.6%), FFO $11.40 (+3.8%) and Core FFO $11.24 (+2.1%).
- The Board declared a Q1 2026 dividend of $1.78 per share, a 1.7% increase, payable April 15, 2026.
- Initial 2026 guidance: Q1 EPS $2.35–$2.45, FFO $2.69–$2.79, Core FFO $2.73–$2.83; full year EPS $6.33–$6.83, FFO $10.80–$11.30, Core FFO $11.00–$11.50.
- Capital markets activity in Q4 2025 included issuance of $400 million 4.35% notes due 2030 and repurchase of 1.89 million shares for $336 million.
- Q4 2025 results: EPS $1.17 (-40.9% y/y); FFO per share $2.80 (+6.5%); Core FFO per share $2.85 (+1.8%).
- Full Year 2025 results: EPS $7.40 (-2.6% y/y); FFO per share $11.40 (+3.8%); Core FFO per share $11.24 (+2.1%).
- Declared Q1 2026 dividend of $1.78 per share, a 1.7% increase over the prior quarter.
- 2026 Outlook: Q1 EPS $2.35–$2.45, FFO $2.69–$2.79, Core FFO $2.73–$2.83; Full Year EPS $6.33–$6.83, FFO $10.80–$11.30, Core FFO $11.00–$11.50.
- AvalonBay Communities will participate in Nareit’s REITworld Conference from December 8–11, 2025.
- Year-to-date through December 5, 2025, repurchased $488 million of common stock at an average price of $182.22, including $336 million since September 30.
- Under agreement to sell three wholly-owned communities, expected to close in Q1 2026 for total gross proceeds of $340 million.
- Issued $400 million of 4.35% senior unsecured notes due December 2030 on December 1, 2025.
- Posted an updated Investor Presentation to its website.
- AvalonBay Communities closed a public offering of $400 million principal amount of 4.350% Senior Notes due December 1, 2030, with interest payable semi-annually on June 1 and December 1, commencing June 1, 2026.
- The Company expects to receive net proceeds of approximately $396.5 million after deducting underwriting discounts and offering expenses.
- Net proceeds are earmarked for working capital and general corporate purposes, including share repurchases, commercial paper repayment, land acquisitions, development and redevelopment of residential communities, acquisitions, funding structured investments, and refinancing existing debt.
- The Notes were issued under the Indenture dated February 23, 2024, as supplemented by a Third Supplemental Indenture dated December 1, 2025, with U.S. Bank Trust Company as trustee; the Underwriting Agreement is filed as Exhibit 1.1.
- Core FFO per share of $2.75, missing the midpoint outlook by ~$0.07, driven by unfavorable same-store residential revenue and higher operating expenses
- Same-store residential revenue growth of 2.3% in Q3 (2.7% YTD)
- 2025 full-year guidance lowered: core FFO growth midpoint down to 2.2%, same-store revenue growth to 2.5%, and operating expense growth raised to 3.8%
- $3.2B development pipeline underway across 22 communities (~8,300 homes) with projected initial stabilized yields of 6.2%, 100–150 bps above underwriting
- Capital markets activity: Q3 development starts of $435 M (YTD $1.0 B), Q3 capital raised of $1.1 B (YTD $2.0 B), and $150 M in share repurchases
- Q3 core FFO per share came in $0.05 below prior outlook, driving a $0.14 reduction in full-year guidance to $11.25 per share, reflecting 2.2% year-over-year earnings growth.
- Apartment demand softened in Q3 due to slower job growth, higher macro uncertainty, and reduced government hiring, contributing to rent deceleration, occupancy dips, and a 30 bp cut to same-store revenue growth expectations.
- Balance sheet remains strong with low leverage, over $3 billion of available liquidity, and $150 million of stock repurchased at an average price of $193 per share in Q3.
- Development pipeline stands at $3.2 billion under construction (95% match-funded) with an untrended yield on cost of 6.2%; the company expects $1.7 billion of development starts in 2025 and roughly $1 billion in 2026 at yields in the mid-6% range.
- Updated full-year same-store outlook assumes 2.5% revenue growth, 3.8% operating expense growth, and 2% NOI growth for residential portfolio.
Quarterly earnings call transcripts for AVALONBAY COMMUNITIES.
Ask Fintool AI Agent
Get instant answers from SEC filings, earnings calls & more