Earnings summaries and quarterly performance for JACK HENRY & ASSOCIATES.
Executive leadership at JACK HENRY & ASSOCIATES.
Board of directors at JACK HENRY & ASSOCIATES.
Curtis A. Campbell
Director
David B. Foss
Board Chair
Lisa M. Nelson
Director
Matthew C. Flanigan
Vice Chair and Lead Director
Shruti S. Miyashiro
Director
Tammy S. LoCascio
Director
Thomas A. Wimsett
Director
Thomas H. Wilson, Jr.
Director
Wesley A. Brown
Director
Research analysts who have asked questions during JACK HENRY & ASSOCIATES earnings calls.
James Faucette
Morgan Stanley
6 questions for JKHY
David Koning
Robert W. Baird & Co.
5 questions for JKHY
Jason Kupferberg
Bank of America
5 questions for JKHY
Kartik Mehta
Northcoast Research
5 questions for JKHY
Rayna Kumar
Oppenheimer & Co. Inc.
5 questions for JKHY
Vasundhara Govil
Keefe, Bruyette & Woods (KBW)
5 questions for JKHY
John Davis
Raymond James Financial
4 questions for JKHY
Andrew Schmidt
Citigroup Inc.
3 questions for JKHY
Cristopher Kennedy
William Blair & Company
3 questions for JKHY
Darrin Peller
Wolfe Research, LLC
3 questions for JKHY
Dominick Gabriele
Compass Point Research & Trading, LLC
3 questions for JKHY
Ken Suchoski
Autonomous Research
3 questions for JKHY
William Nance
The Goldman Sachs Group, Inc.
3 questions for JKHY
Charles Nabhan
Stephens Inc.
2 questions for JKHY
Christopher Kennedy
William Blair & Company LLC
2 questions for JKHY
Daniel Perlin
RBC Capital Markets
2 questions for JKHY
Kenneth Suchoski
Autonomous Research LLP
2 questions for JKHY
Madison Suhr
Raymond James
2 questions for JKHY
Peter Heckmann
D.A. Davidson
2 questions for JKHY
Abigail Rudder
Oppenheimer & Co. Inc.
1 question for JKHY
Andrew Bauch
Wells Fargo & Company
1 question for JKHY
Nik Cremo
UBS Group AG
1 question for JKHY
Will Nance
Goldman Sachs
1 question for JKHY
Recent press releases and 8-K filings for JKHY.
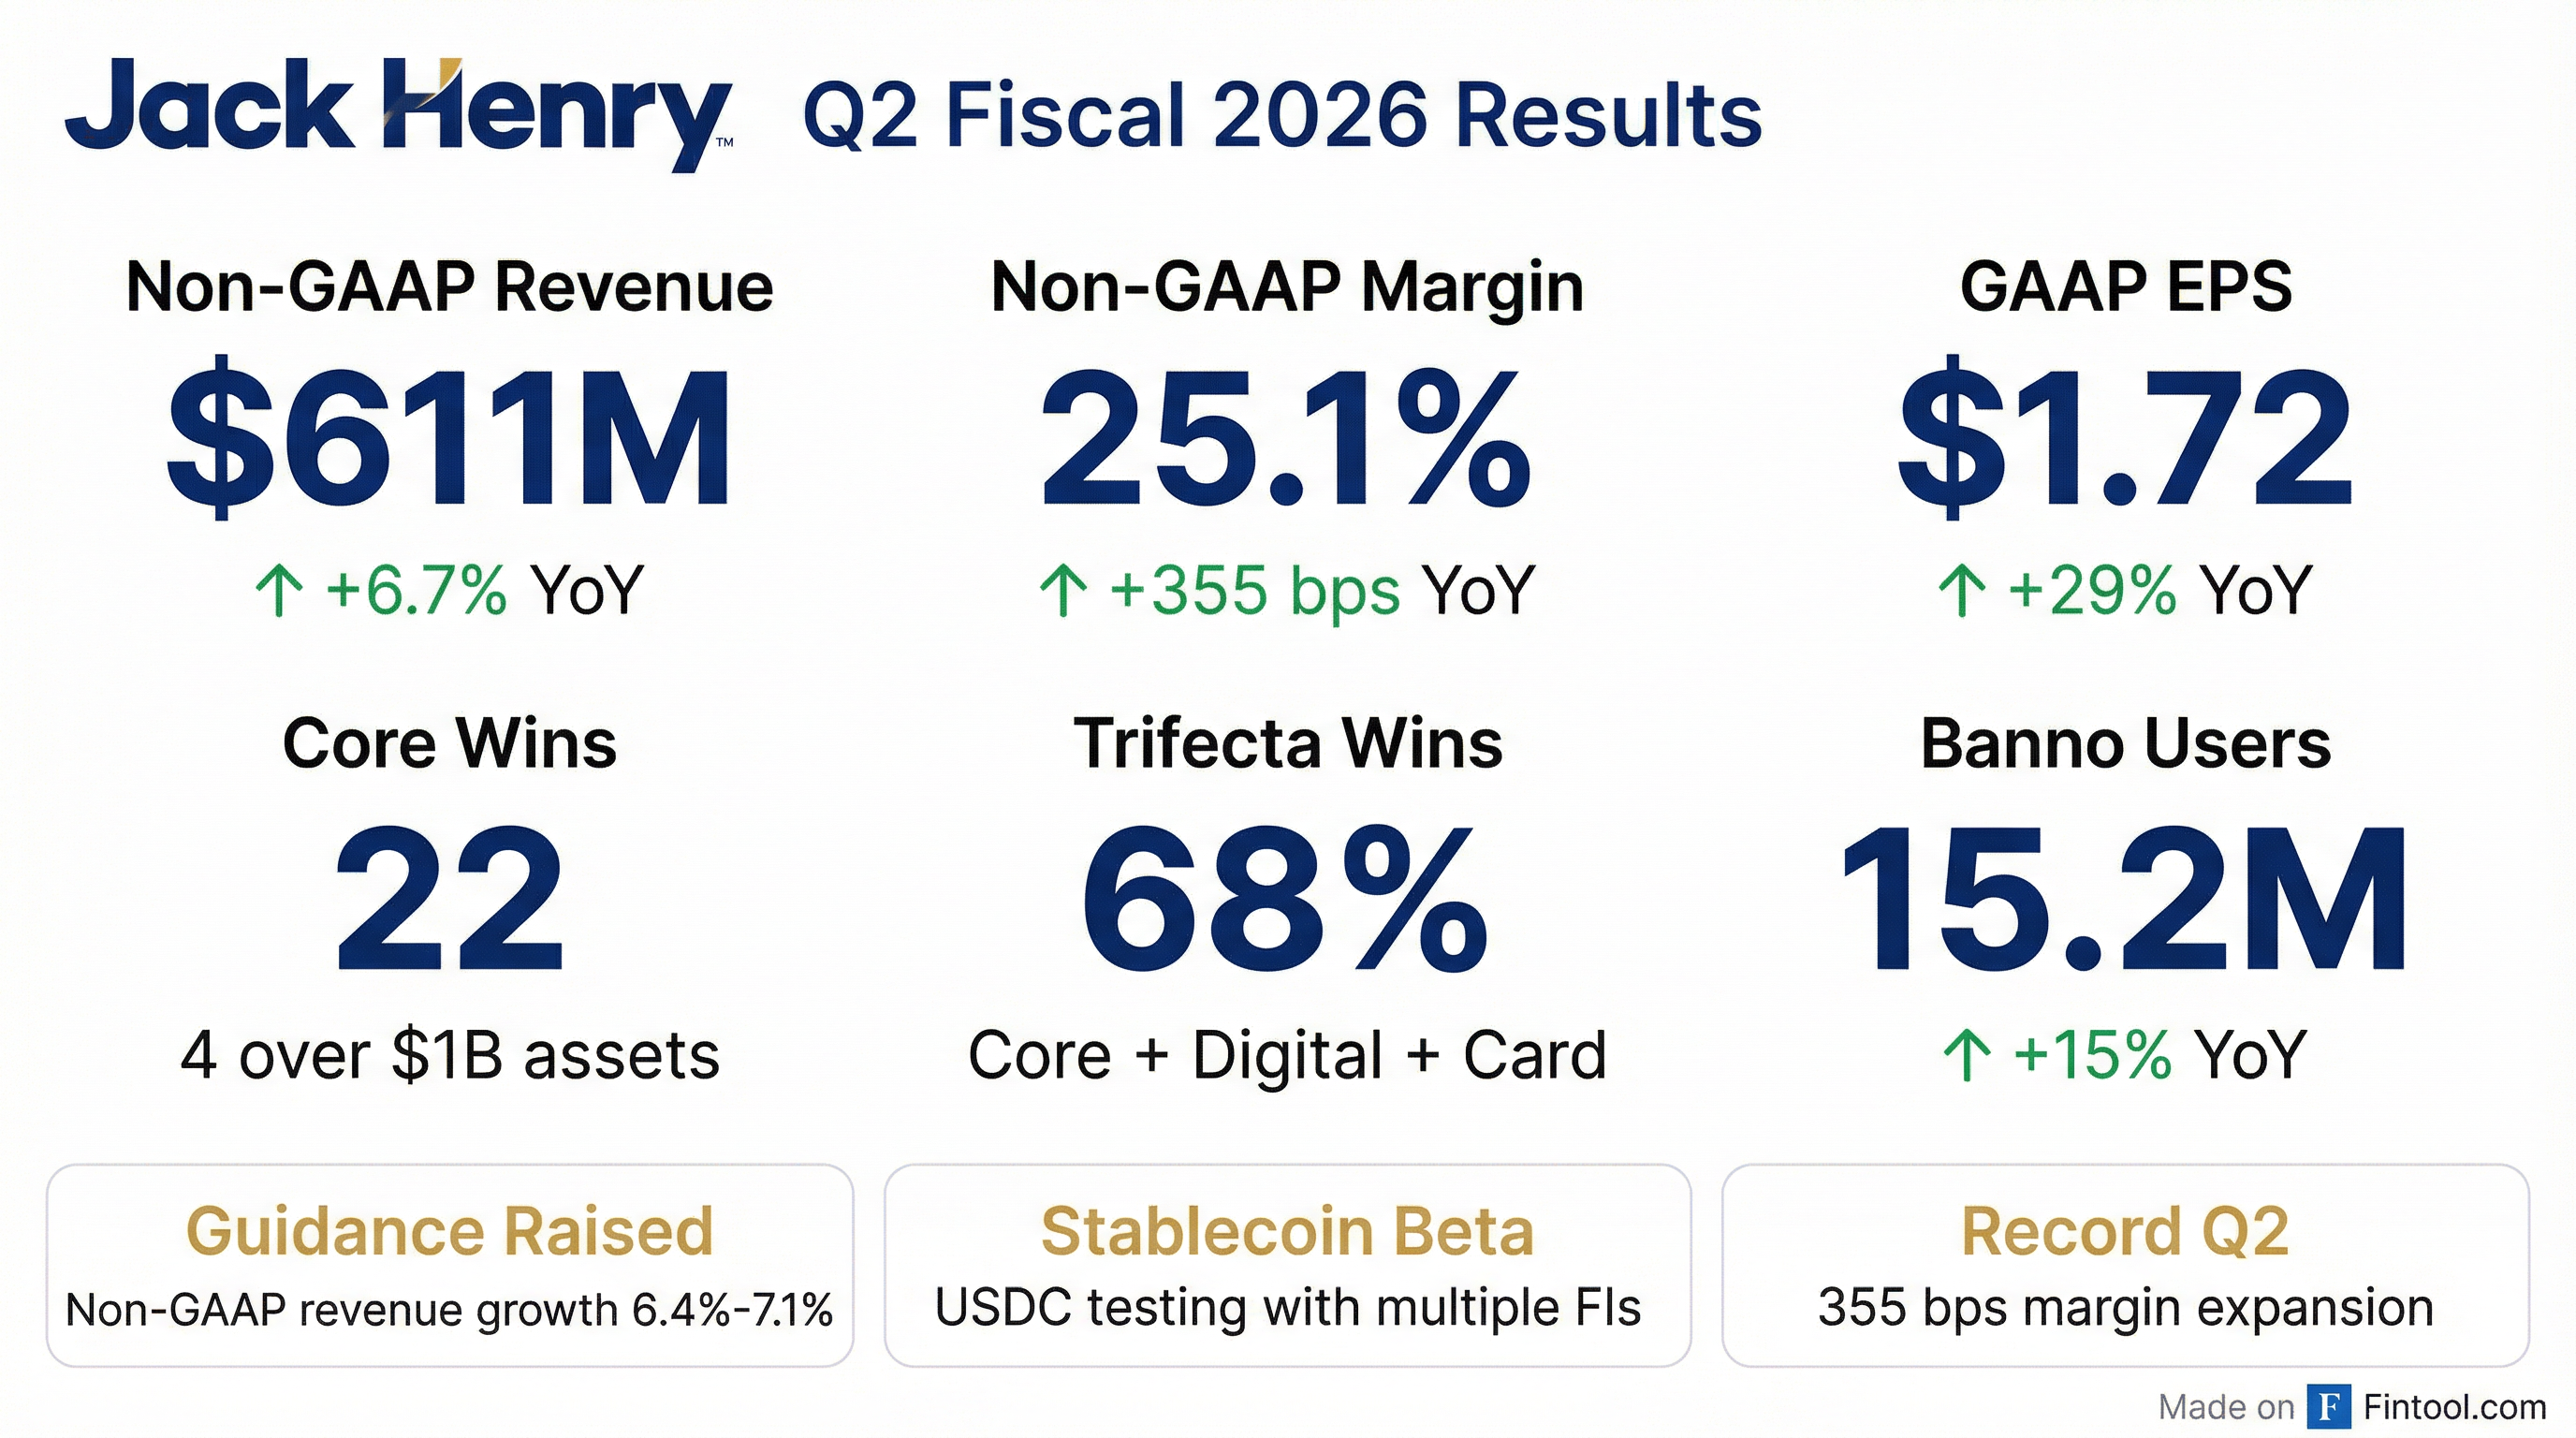
- Jack Henry posted Q2 non-GAAP revenue of $611 million (up 6.7% YoY) and a 25.1% non-GAAP operating margin (355 bps expansion).
- Raised fiscal 2026 guidance to 5.6%–6.3% GAAP revenue growth, 6.4%–7.1% non-GAAP revenue growth, 50–75 bps of non-GAAP margin expansion, and GAAP EPS of $6.61–$6.72.
- Secured 22 competitive core wins, with 68% of new core contracts including digital and card solutions, driving continued market share gains across banks and credit unions.
- Advanced product innovation: rolled out cloud-native Tap2Local to 400+ clients, launched Rapid Transfers with 75 live clients, initiated USDC stablecoin beta tests, and integrated Victor Technologies for embedded payments.
- Recorded non-GAAP revenue of $611 million (+6.7% YoY) and non-GAAP operating margin of 25.1% (+355 bps YoY) in Q2 FY 2026.
- Raised full-year non-GAAP revenue growth guidance to 6.4–7.1% and margin expansion to 50–75 bps; GAAP EPS now expected at $6.61–6.72 and free cash flow conversion at 90–100%.
- Core segment delivered 22 competitive core wins, with 68% of new core deals including digital banking and card solutions (versus 45% in Q2 FY 2025).
- Rolled out Tap2Local merchant acquiring to 400+ Banno clients (300 in Nov–Dec, 100 more in Jan) and activated Rapid Transfers with 75 live clients and 180 in onboarding.
- Banno digital platform signed 84 new clients; now serves 1,037 retail clients and 15.2 million registered users (+15% YoY).
- Jack Henry delivered record Q2 non-GAAP revenue of $611 million (up 6.7% YoY) and a 25.1% non-GAAP operating margin (up 355 bps), with GAAP EPS of $0.72 (up 29%). Q2 operating cash flow was $153 million and free cash flow $103 million; the company repurchased $125 million of shares in the first half.
- Management raised full-year guidance, now targeting GAAP revenue growth of 5.6%–6.3%, non-GAAP revenue growth of 6.4%–7.1%, non-GAAP margin expansion of 50–75 bps, and GAAP EPS of $6.61–$6.72; free cash flow conversion is expected at 90%–100%.
- The firm advanced its product roadmap with the rollout of Tap2Local merchant acquiring (300 clients live; +100 clients last week; adding 100–150/month) and Rapid Transfers (75 live; 180 onboarding), plus beta testing of USDC stablecoin transfers and expanded embedded payments via Victor Technologies integration.
- Sales momentum remained strong with 22 competitive core wins (including 4 institutions >$1 billion in assets and 15 trifecta wins), continued market-share gains over 8 years (banks +17%; credit unions +40%), and 84 new Banno digital platform clients, serving 15.2 million users (+15% YoY).
- Q2 GAAP revenue increased 7.9%, GAAP operating income rose 29.4%, and GAAP EPS was $1.72 (+28.6%) for the quarter ended December 31, 2025.
- Fiscal YTD GAAP revenue grew 7.6%, GAAP operating income increased 25.1%, and GAAP EPS reached $3.70 (+24.5%).
- Cash and cash equivalents were $28.2 million and debt outstanding was $20 million at December 31, 2025.
- FY26 guidance: GAAP revenue of $2,508 M–$2,525 M, EPS of $6.61–$6.72; non-GAAP adjusted revenue of $2,474 M–$2,491 M and adjusted operating margin of 23.7%–23.9%.
- Jack Henry & Associates’s GAAP revenue for Q2 fiscal 2026 rose 7.9% to $619.3 million, while GAAP operating income increased 29.4% to $159.1 million for the quarter ended December 31, 2025.
- GAAP EPS was $1.72, up 28.6% year-over-year.
- The company reaffirmed full-year fiscal 2026 guidance of $2.508 billion–$2.525 billion in GAAP revenue, EPS of $6.61–$6.72, and operating margin of 24.3%–24.5%.
- Cash and cash equivalents were $28.2 million and credit facility debt was reduced to $20 million as of December 31, 2025.
- Jack Henry Rapid Transfers is a new cloud-native solution enabling immediate, secure me-to-me money movement via Visa Direct and Mastercard Move for consumers and SMBs through banks and credit unions.
- The service is fully integrated into the Banno Digital Platform, which serves over 1,000 financial institutions and 15 million registered users as of November 30, 2025.
- Since its rollout in September, Rapid Transfers is live at 65 institutions with 170 more in implementation, aiming to boost deposit growth and accountholder loyalty.
- Jack Henry sees a multi-year opportunity to capture core system migrations as a competitor consolidates over a dozen platforms, leveraging its historical win rate of ~50 annual core deals.
- The payments segment benefits from resilient consumer spending and accelerating adoption of FedNow, RTP and Zelle, and a new Move partnership enables instant debit transfers and small-business merchant acceptance, poised to become a major revenue driver over five years.
- Deployment of 130+ AI use cases across product development and corporate functions is boosting development velocity and operational efficiency, setting up potential margin tailwinds without reducing headcount growth.
- With 90–100% free cash flow conversion, Jack Henry will continue investing 14–15% of revenue in R&D, maintain its dividend, and has the flexibility for larger share buybacks and strategic M&A.
- Jack Henry serves primarily U.S. credit unions and banks through three operating segments: core processing systems (~33% of revenue), payments (card issuance & processing, enterprise payment services, faster payments), and complementary services including fraud, lending, and digital offerings.
- The consolidation of a competitor’s multiple core platforms presents a multi-year opportunity for Jack Henry to capture additional core migrations, potentially exceeding its typical ~50 annual core wins as institutions face complex migrations and no immediate sunset dates.
- In its payments segment, Jack Henry is achieving double-digit growth in faster payment rails (FedNow, RTP, Zelle) and has launched a small business initiative via its Move partnership to enable real-time debit transfers and POS payments for micro-merchants, targeting significant future revenue contributions.
- The company reports 90–100%+ free cash flow conversion, maintains a 14–15% revenue R&D spend, and upholds its dividend growth policy while opening the door for more substantial share buybacks and strategic acquisitions aligned with its cloud-native strategy.
- Jack Henry serves banks and credit unions through three segments—core, payments, complementary—and sees a multi-year opportunity to win migrations from a competitor consolidating over 1,400 legacy core platforms.
- Core contract renewals typically span 7–10 years, with institutions issuing RFPs about 2 years before expiration and migrations taking 12–18 months, implying P&L benefits will accrue over multiple years.
- In payments, Jack Henry is leveraging robust consumer spending and faster-payment rails (FedNow, RTP, Zelle), and has launched a small-business instant payments solution via Mastercard Move and tap-to-pay on smartphones, projected to be a major revenue driver over the next five years.
- The firm has identified 130+ AI use cases across products and corporate functions, accelerating software development and improving operational efficiency to support margin expansion.
- With 90–100% free cash flow conversion restored, Jack Henry maintains 14–15% R&D investment, steady dividend growth, and now plans for significant share buybacks alongside targeted M&A, evidenced by the Victor FI deal.
- Demand environment improving to 8–10% from 3–5% a year ago, based on Jack Henry and Bank Director surveys.
- Jack Henry wins roughly 50 core deals per year from a pool of ~200 decisions, with a sustained ~50% win rate and an expected rise in opportunities due to competitor core consolidation impacting ~1,400 clients.
- Migration of customers to Jack Henry’s private cloud (~77% complete) delivers a 1.75% average revenue uplift, and transitioning to the public cloud is expected to add an additional 20–25% revenue lift.
- Payments growth driven by 55% year-over-year transaction increase in card processing and PayCenter faster-payment services, while SMB acquiring expanded via a Moov partnership.
- Capital allocation priorities include 21 consecutive years of dividend increases, zero debt, a targeted $200 million share buyback for 2025, and strategic acquisitions like Victor Technologies to bolster cloud-native and embedded finance offerings.
Quarterly earnings call transcripts for JACK HENRY & ASSOCIATES.
Ask Fintool AI Agent
Get instant answers from SEC filings, earnings calls & more