Earnings summaries and quarterly performance for PayPal Holdings.
Executive leadership at PayPal Holdings.
Alex Chriss
President and Chief Executive Officer
Aaron Webster
Executive Vice President, Global Chief Risk Officer
Diego Scotti
Executive Vice President, General Manager, Consumer Group
Frank Keller
Executive Vice President, General Manager – Large Enterprise & Merchant Platform Group
Jamie Miller
Executive Vice President, Chief Financial and Operating Officer
Michelle Gill
Executive Vice President, General Manager – Small Business & Financial Services Group
Suzan Kereere
President, Global Markets
Board of directors at PayPal Holdings.
Ann Sarnoff
Director
Carmine Di Sibio
Director
David Dorman
Director
David Moffett
Director
Deborah Messemer
Director
Deirdre Stanley
Director
Enrique Lores
Independent Board Chair
Frank Yeary
Director
Gail McGovern
Director
Jonathan Christodoro
Director
Joy Chik
Director
Research analysts who have asked questions during PayPal Holdings earnings calls.
Harshita Rawat
AllianceBernstein
8 questions for PYPL
Tien-tsin Huang
JPMorgan Chase & Co.
8 questions for PYPL
Dan Dolev
Mizuho Financial Group
7 questions for PYPL
Darrin Peller
Wolfe Research, LLC
7 questions for PYPL
Jason Kupferberg
Bank of America
7 questions for PYPL
Ramsey El-Assal
Barclays
6 questions for PYPL
Sanjay Sakhrani
Keefe, Bruyette & Woods (KBW)
6 questions for PYPL
Timothy Chiodo
UBS Group AG
6 questions for PYPL
Andrew Schmidt
Citigroup Inc.
5 questions for PYPL
Trevor Williams
Jefferies LLC
3 questions for PYPL
Colin Sebastian
Baird
2 questions for PYPL
James Faucette
Morgan Stanley
2 questions for PYPL
Will Nance
Goldman Sachs
2 questions for PYPL
Bryan Keane
Deutsche Bank
1 question for PYPL
Daniel Perlin
RBC Capital Markets
1 question for PYPL
Darren Peller
Wolfe Research
1 question for PYPL
Sanjay Sakrani
KBW
1 question for PYPL
William Nance
The Goldman Sachs Group, Inc.
1 question for PYPL
Recent press releases and 8-K filings for PYPL.
- Levi & Korsinsky, LLP is probing PayPal for a notable gap between its prior outlook and actual fourth quarter 2025 results.
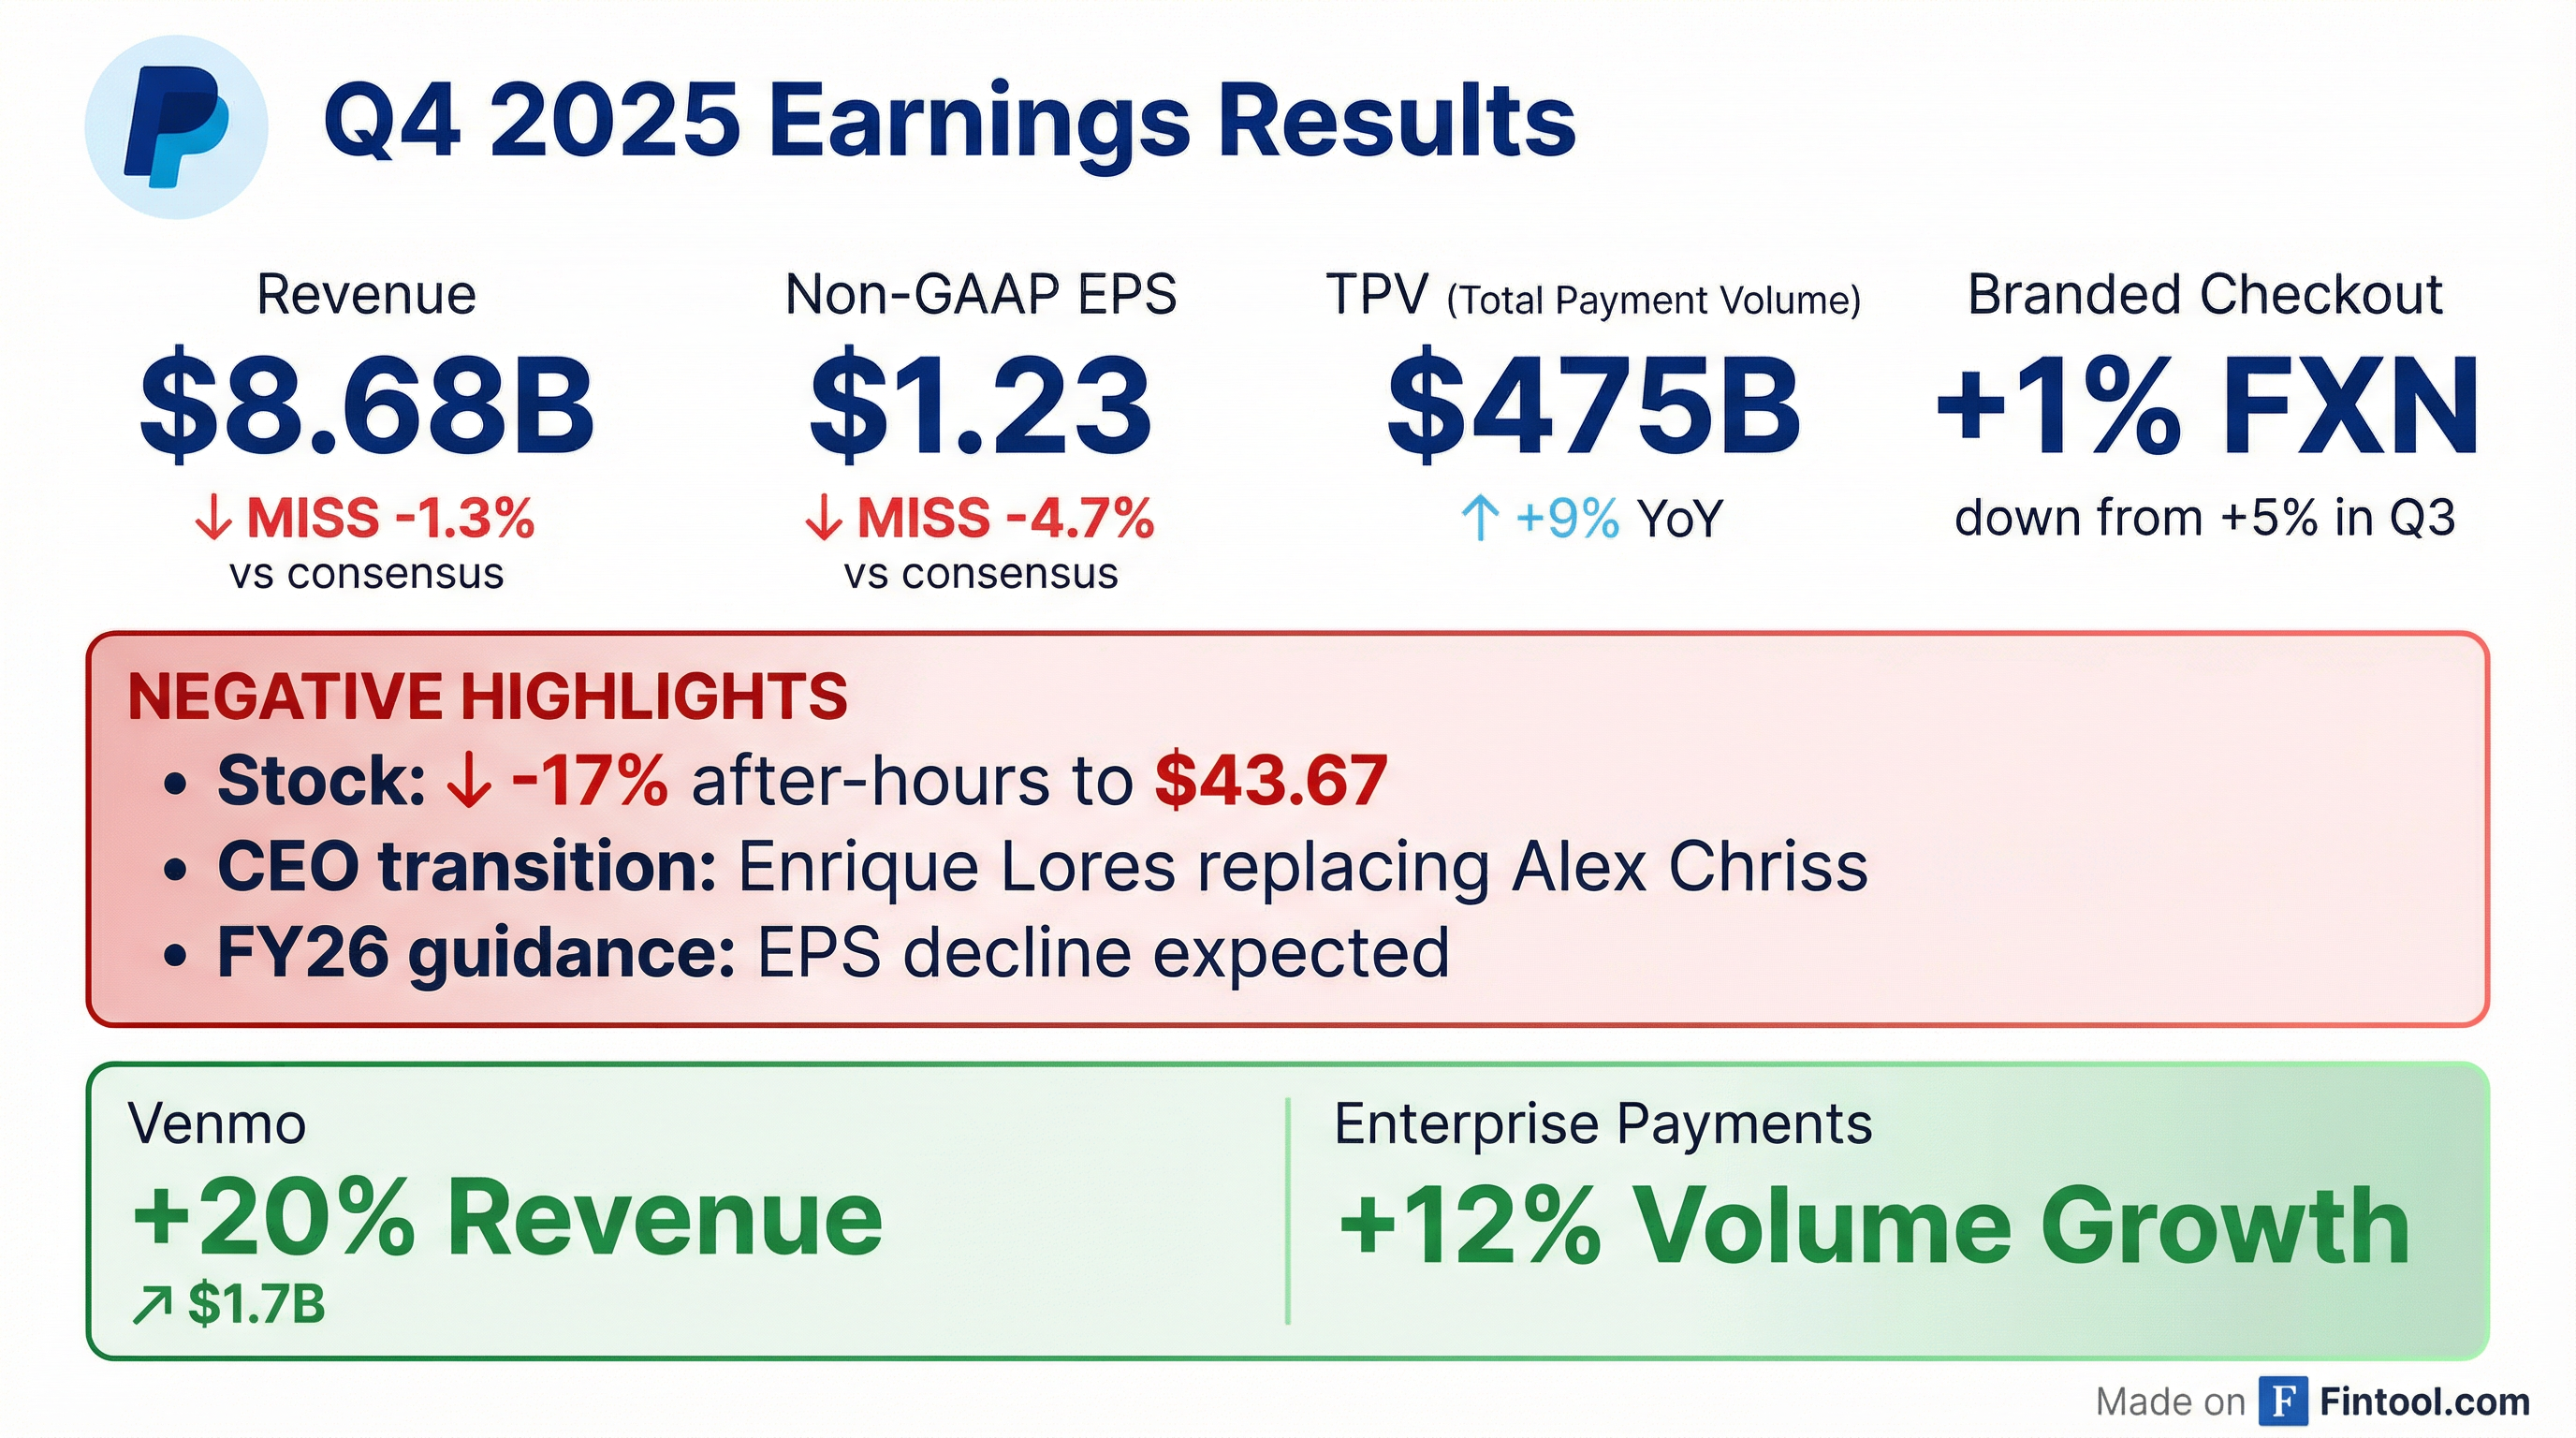
- Q4 2025 revenue was $8.68 billion, missing estimates by $120 million (~1.4%), and adjusted EPS of $1.23 fell short of the $1.30–$1.33 consensus (5.4–7.5% miss).
- The company’s 2026 guidance forecasts a decline in transaction margin dollars and adjusted EPS ranging from a low-single-digit fall to a modest gain, below analyst models.
- Shares plunged 19–20% to about $42, establishing a new 52-week low after the announcement.
- Report projects the Poland BNPL market will grow by 24.7% in 2026 to US$4.09 billion.
- The sector recorded a 27.7% CAGR from 2022–2025 and is forecast to sustain a 21.3% CAGR through 2026–2031.
- Market size is expected to expand from US$3.28 billion in 2025 to US$10.72 billion by 2031.
- Analysis is underpinned by 90+ KPIs, including market size, segment breakdowns, and consumer behaviour, with competitive insights on PayPo, Klarna, Twisto, PayPal, and PayU.
- Forecast period covers 2026–2031, offering strategic inputs for investment and expansion in Poland’s BNPL landscape.
- PayPal’s Board has appointed Enrique Lores as President and Chief Executive Officer, effective March 1, 2026, succeeding Alex Chriss, with Jamie Miller serving as Interim CEO until Lores assumes the role.
- David W. Dorman has been named Independent Board Chair, effective immediately, and Enrique Lores relinquishes the Board Chair position while remaining a director.
- The leadership changes follow a strategic board evaluation aimed at accelerating execution, innovation, and PayPal’s competitive position in a rapidly evolving AI-driven payments landscape.
- Law Offices of Frank R. Cruz launched an investigation into PayPal for possible federal securities law violations, urging shareholders who lost money to contact the firm.
- On February 3, 2026, PayPal replaced CEO Alex Chriss, citing execution and pace of change below the Board’s expectations.
- In its Q4 and FY 2025 results, PayPal reported adjusted EPS of $1.23 (vs. $1.29 expected) and revenue of $8.68 billion (vs. $8.79 billion expected), and admitted branded checkout execution issues.
- PayPal’s stock fell as much as 20% intraday on the news, leading to investor losses.
- PayPal reported Q4 revenue of $8.68 billion and adjusted EPS of $1.23, missing Street estimates; total payment volume rose 6% to $475.1 billion, while branded-checkout growth slowed to 1%.
- The board announced CEO Alex Chriss will be replaced by Enrique Lores (former HP CEO) on March 1, with CFO Jamie Miller serving as interim until then.
- Issued a full-year 2026 adjusted profit outlook calling for a low-single-digit decline or slight growth, below Wall Street’s ~8% growth expectation, and warned Q1 earnings may fall mid-single-digits.
- Shares plunged 15–17% in premarket trading, hitting as low as $43.26, amid concerns over execution, softer U.S. retail demand and intensifying competition.
- The board appointed Enrique Lores as President and CEO effective March 1, with Jamie Miller serving as interim CEO during the transition and David Dorman named Board Chair.
- Full-year 2025 revenue was $33.2 billion, up 4% on a spot and currency-neutral basis; Q4 total payment volume reached $475 billion (-9% spot, +6% FX-neutral), driving FY TPV of $1.8 trillion (+7% spot).
- Non-GAAP EPS grew 14% to $5.31 for 2025, with Q4 revenue up 4% spot (3% FX-neutral); adjusted free cash flow was $6.4 billion for the full year.
- Key growth drivers included Venmo revenue of $1.7 billion (+20%), Q4 Venmo TPV +13%, Buy Now, Pay Later TPV >$40 billion (+20%), and seven consecutive quarters of profitable growth in enterprise payments, while online branded checkout volume grew just 1%.
- Underperformance in online branded checkout prompted increased investment in experience, presentment, and rewards; 2026 guidance assumes flat TM dollars, non-GAAP EPS down low single digits to slightly positive, ~$6 billion in share repurchases, and ≥$6 billion in adjusted free cash flow.
- PayPal appointed Enrique Lores as President and CEO effective March 1 and named David Dorman as Board Chair, with Steve serving as interim CEO during the transition.
- In 2025, Venmo revenue grew approximately 20% to $1.7 billion with active accounts surpassing 100 million and 14% ARPA growth; enterprise payments delivered seven consecutive quarters of profitable growth; and BNPL TPV exceeded $40 billion, up over 20% YoY. Transaction margin dollars ex-interest rose 6% for the year; non-GAAP operating income was $6.4 billion, up 9%; full-year share repurchases totaled $6 billion and PayPal initiated a $0.14 quarterly dividend.
- Online branded checkout underperformed in Q4, with TPV growth slowing to 1% (from 5% in Q3) due to U.S. retail weakness, international headwinds (notably Germany), and decelerating high-growth verticals, compounded by deployment and integration challenges.
- For 2026, PayPal plans approximately 3 points of transaction margin headwind from targeted investments, guiding to low single-digit revenue growth in Q1, roughly flat to slightly down TM dollars ex-interest, and mid-single-digit non-GAAP EPS decline.
- Online branded checkout TPV grew 1% in Q4, down from 5% in Q3, due to U.S. retail weakness, German macro headwinds, vertical slowdowns, and integration challenges.
- 2026 priorities focus on experience (biometric/passkey adoption), presentment (upstream BNPL messaging), and selection (rewards programs) to accelerate branded checkout growth.
- Venmo TPV +13% and MAAs +7%, U.S. debit card TPV +50% and MAAs +35%, and enterprise PSP margins doubled net processing yield in Q4.
- Capital allocation: completed $6 B share repurchases and launched $0.14/share dividend in 2025; 2026 guidance assumes low single-digit branded checkout growth and mid-single-digit non-GAAP EPS decline, reflecting a ~3-point headwind from targeted investments.
- Management change: Board appointed Enrique Ortiz as next CEO to drive faster execution and clear prioritization in 2026.
- PayPal named Enrique Lores President and CEO effective March 1, 2026, with CFO/COO Jamie Miller serving as interim CEO and David W. Dorman appointed independent board chair.
- Q4 adjusted EPS of $1.23 missed consensus of $1.29; revenue of $8.68 billion versus $8.79 billion expected; total payment volume rose 9% to $475.1 billion.
- Fiscal 2026 EPS guidance set at $5.75, slightly above consensus, and warned of a mid-single-digit decline in Q1 earnings; declared a $0.14 quarterly dividend.
- Shares tumbled about 15–16% in premarket trading following the results and modest guidance.
- In Q4’25, net revenues grew 4% to $8.7 bn and in FY’25 to $33.2 bn, both +4% FXN.
- Q4 GAAP EPS was $1.53, up 38% YoY; non-GAAP EPS was $1.23, up 3%; FY’25 GAAP EPS $5.41 (+35%), non-GAAP EPS $5.31 (+14%).
- Q4 total payment volume reached $475.1 bn, up 9% YoY (6% FXN); active accounts were 439 m, up 1.1% YoY.
- The Board appointed Enrique Lores as the next President and CEO to strengthen execution and innovation.
- For 1Q’26, PayPal sees GAAP EPS declining mid-single digits and non-GAAP EPS declining mid-single digits; FY’26 GAAP EPS also mid-single digit decline and non-GAAP EPS down low-single digits to slightly positive.
Fintool News
In-depth analysis and coverage of PayPal Holdings.


Quarterly earnings call transcripts for PayPal Holdings.
Ask Fintool AI Agent
Get instant answers from SEC filings, earnings calls & more