Earnings summaries and quarterly performance for S&P Global.
Executive leadership at S&P Global.
Martina Cheung
Chief Executive Officer
Bhavesh Dayalji
Chief AI Officer
Dave Ernsberger
President, S&P Global Energy
Eric Aboaf
Chief Financial Officer
Sally Moore
Chief Client Officer
Saugata Saha
President, S&P Global Market Intelligence; Chief Enterprise Data Officer
Steven Kemps
Chief Legal Officer
Yann Le Pallec
President, S&P Global Ratings
Board of directors at S&P Global.
Research analysts who have asked questions during S&P Global earnings calls.
Ashish Sabadra
RBC Capital Markets
9 questions for SPGI
Craig Huber
Huber Research Partners
9 questions for SPGI
Faiza Alwy
Deutsche Bank
9 questions for SPGI
Jason Haas
Wells Fargo
9 questions for SPGI
Jeffrey Silber
BMO Capital Markets
9 questions for SPGI
Manav Patnaik
Barclays
9 questions for SPGI
Scott Wurtzel
Wolfe Research
9 questions for SPGI
Toni Kaplan
Morgan Stanley
9 questions for SPGI
Alex Kramm
UBS Group AG
7 questions for SPGI
Andrew Steinerman
JPMorgan Chase & Co.
7 questions for SPGI
George Tong
Goldman Sachs
7 questions for SPGI
Russell Quelch
Redburn Atlantic
7 questions for SPGI
Surinder Thind
Jefferies Financial Group
6 questions for SPGI
Andrew Nicholas
William Blair & Company
5 questions for SPGI
Jeff Meuler
Robert W. Baird & Co.
5 questions for SPGI
Owen Lau
Oppenheimer & Co. Inc.
5 questions for SPGI
Sean Kennedy
Mizuho Securities
5 questions for SPGI
Shlomo Rosenbaum
Stifel, Nicolaus & Company, Incorporated
5 questions for SPGI
David Motemaden
Evercore ISI
4 questions for SPGI
Jeffrey Meuler
Robert W. Baird & Co. Incorporated
4 questions for SPGI
Peter Christiansen
Citigroup Inc.
3 questions for SPGI
Alex Hess
JPMorgan Chase & Co.
2 questions for SPGI
Keen Fai Tong
Goldman Sachs Group Inc.
2 questions for SPGI
Kwun Sum Lau
Oppenheimer
2 questions for SPGI
Joshua Dennerlein
BofA Securities
1 question for SPGI
Shlomo Rosenbaum
Stifel Financial Corp.
1 question for SPGI
Thomas Roesch
William Blair
1 question for SPGI
Recent press releases and 8-K filings for SPGI.
- S&P Global’s proprietary benchmarks, ratings, indices, and price assessments account for roughly 75% of operating income, while workflow tools contribute 13% of revenue as “enterprise-grade critical systems of record” supporting regulatory and capital allocation tasks.
- The company has engaged about 140 customers via its Cloud for Financial Services MCP connector and Microsoft Copilot integrations; AI-enabled clients in energy have delivered 2× ARR growth and 4% higher retention versus the broader base.
- S&P protects its IP through bilateral client agreements, technical permissioning (MCP connector, grounding agent), data-throttling, and prohibits use of its data for LLM training.
- AI initiatives target 20% expense savings in the Enterprise Data Office by end-2027 and 10%+ software developer productivity gains, underpinning an annual 50–75 bp margin expansion across businesses.
- In ratings and private markets, hyperscale data center CapEx announcements total $700 billion (potentially driving 2–3% build issuance growth), while private market fundraising rose 11% in 2025 (70% Europe/multi-region); S&P applies identical methodologies for public/private ratings and is launching new indices using With Intelligence data.
- Benchmark businesses (ratings, indices, Platts) contribute ~75% of S&P Global’s operating income, while workflow platforms account for 13% of revenue and are highly sticky.
- AI integrations via Cloud for Financial Services and Microsoft Copilot have attracted ~140 customers (80 using the MCP connector, 60 using Copilot add-on), yielding 2× ARR growth and 4% higher retention among energy clients.
- Strategic AI initiatives are expected to deliver 50–75 bps of annual margin expansion; for example, the Enterprise Data Office is targeting 20% expense savings by end 2027, with software developer productivity already up 10%+.
- Ratings growth is supported by hyperscale data center issuance (adding ~2 pp of revenue growth) and expansion into private credit and private markets (11% fundraising increase in 2025, with ~70% in Europe/multi-region), plus new index products via With Intelligence.
- S&P Global emphasised that its proprietary data and enterprise-grade workflow tools (13% of revenue) remain highly sticky and essential, differentiating them from commoditized solutions.
- The firm’s AI partnerships have onboarded 80 clients using the MCP connector in Cloud for Financial Services and 60 clients paying for energy content via Microsoft Copilot, driving 2× ARR growth and 4% higher retention among Copilot users.
- Management reaffirmed 50–75 bps of annual margin expansion, underpinned by AI-led productivity programmes (e.g., 20% cost savings in its Enterprise Data Office by end-2027).
- In Ratings, S&P is well positioned for data centre and hyperscale issuance, citing $700 billion of announced CapEx that could add 1–4 points of revenue growth, though timing and debt-funding mix remain uncertain.
- Private markets remain a key growth driver, with 11% fundraising growth in 2025 (70% in Europe/multi-region) and expansion of private credit ratings, indices and data workflows via the With Intelligence acquisition.
- Revenue of €1,595 million in 2025, down 1% year-on-year.
- EBITDA at €859 million, up 4% and exceeding the 2025 guidance range.
- Net profit of €320 million, representing a 3% increase versus 2024.
- Board proposes a dividend of €0.80 per share, up from €0.58 in 2024.
- 2026 EBITDA is expected to grow above the recalculated base of €822 million.
- AFFO: Recorded $48.5 million in Q4 2025 ($0.22 per share) and $221.0 million for the full year ($0.99 per share), surpassing the revised full-year guidance of $0.95–$0.97.
- Revenue was $117.0 million in Q4 2025, down from $137.8 million in Q4 2024, while net income attributable to common stockholders swung to $37.2 million profit versus a $17.5 million loss a year ago.
- Balance sheet strengthened with net debt reduced by $2.2 billion, improving net debt to Adjusted EBITDA from 7.6x to 6.7x in 2025.
- Share buyback: Repurchased 17.2 million shares at a weighted average price of $7.88, totaling $135.9 million under the program launched February 2025.
- 2026 guidance: AFFO per share of $0.80–$0.84 and net debt to Adjusted EBITDA of 6.5x–6.9x.
- S&P Global appointed Martin Metzker as Chief Strategy Officer of its Mobility Global unit, effective immediately, reporting to CEO-designate Bill Eager.
- Metzker joins from Boston Consulting Group and will oversee strategy, communications, and enterprise marketing ahead of Mobility’s planned spin-off.
- The appointment completes the executive leadership team for the future standalone company, including CFO Matt Calderone and CIO Joedy Lenz.
- S&P Global expects to finalize Mobility Global’s separation into a public company by mid-2026, subject to regulatory approvals.
- Pre-tax profit rose to €338 million, up 6% YoY, while EBITDA grew 28% to €454.7 million.
- A historic record of €106.7 million in new and renewed leases increased annualised committed leases to €468.3 million (+ 13.5%).
- Development pipeline comprises 43 projects under construction (1,052,000 sqm) adding €85 million of annual rent, with the pipeline 75% pre-let and €80.9 million secured.
- Strong balance sheet: €524 million cash, €500 million undrawn facilities, LTV at 50%, and net debt/EBITDA down to 6.3x.
- Board proposes an ordinary dividend of €92.8 million (€3.40 per share, + 3%).
- Private credit lending outpaced broadly syndicated loans for 'B-' and below-rated borrowers for four consecutive years, reaching $146 billion in 2025 vs $85 billion in syndicated markets.
- Tech sector debt issuance hit a record 16.7% of global non-financial corporate bond issuance in 2025, up from 11.6% in 2024.
- The top five U.S. hyperscalers plan $600 billion in capital expenditures in 2026, a 38% increase over 2025’s 68% growth.
- U.S. maturities of 'B-' and below-rated debt are projected to surge to $215 billion in 2028, up from $56.6 billion in 2026, intensifying refinancing pressures.
- Global data center securitization volumes reached $30 billion in 2025, nearly tripling from just over $10 billion in 2024.
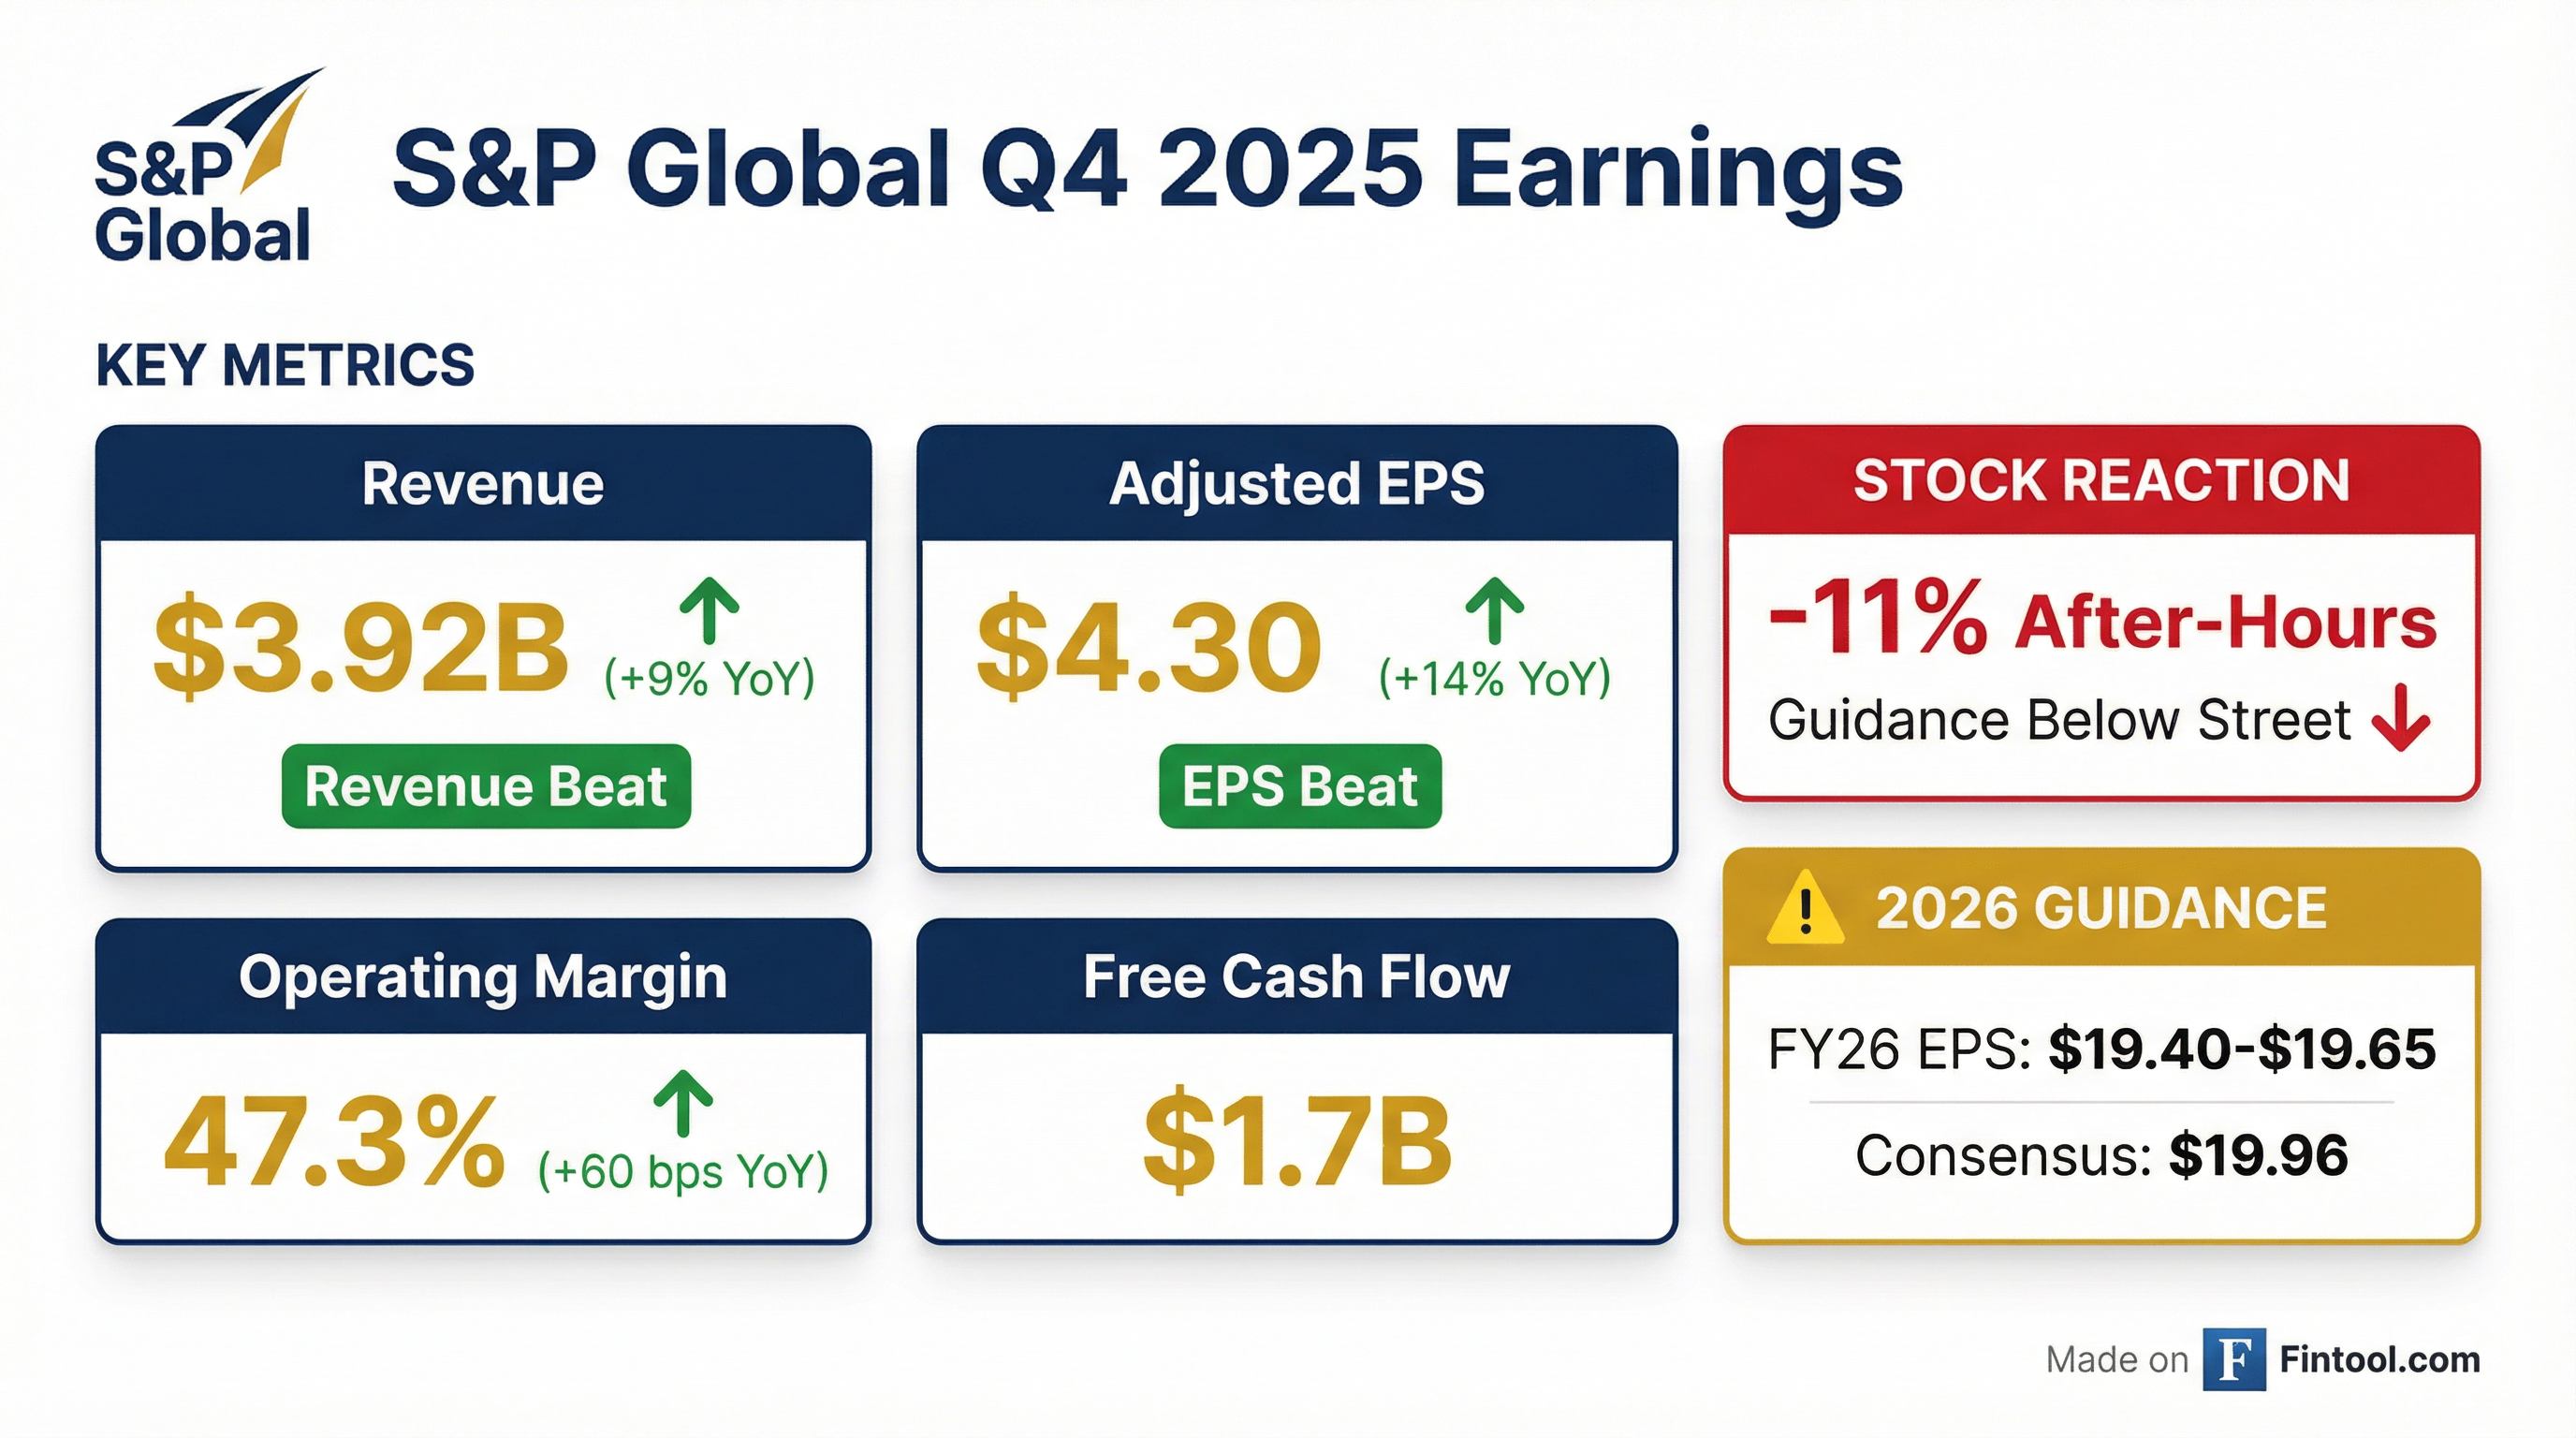
- S&P Global delivered 8% revenue growth, 140 bps adjusted operating margin expansion, and 14% diluted EPS growth in FY 2025, returning 113% of free cash flow to shareholders.
- For 2026, the company guides 6.0%–8.0% organic constant-currency revenue growth (6.6%–8.6% reported) and $19.40–$19.65 adjusted EPS (+9%–10% y/y).
- The planned spin-off of Mobility is on track for mid-2026, with public Form 10 filings, an Investor Day and equity roadshow slated for 2Q 2026.
- S&P Global delivered Q4 2025 revenue growth of +9% reported and +8% organic constant currency; adjusted diluted EPS rose 14% year-over-year.
- Strong performance across divisions: Ratings revenue up 12%, Market Intelligence subscription revenue +7%, Energy +6%, Indices +14%, and Mobility +8%.
- 2026 guidance includes organic constant currency revenue growth of 6–8%, adjusted EPS of $19.40–$19.65 (+9–10%), and 50–75 bps of margin expansion.
- Returned capital with over $5 billion in share repurchases, 53rd consecutive dividend increase, and 113% of free cash flow returned to shareholders in 2025.
Fintool News
In-depth analysis and coverage of S&P Global.

Quarterly earnings call transcripts for S&P Global.
Ask Fintool AI Agent
Get instant answers from SEC filings, earnings calls & more