Earnings summaries and quarterly performance for Apple.
Executive leadership at Apple.
Board of directors at Apple.
Research analysts who have asked questions during Apple earnings calls.
Amit Daryanani
Evercore
7 questions for AAPL
David Vogt
UBS Group AG
7 questions for AAPL
Erik Woodring
Morgan Stanley
7 questions for AAPL
Michael Ng
Goldman Sachs
7 questions for AAPL
Samik Chatterjee
JPMorgan Chase & Co.
7 questions for AAPL
Wamsi Mohan
Bank of America Merrill Lynch
7 questions for AAPL
Richard Kramer
Arete Research
6 questions for AAPL
Aaron Rakers
Wells Fargo
5 questions for AAPL
Atif Malik
Citigroup Inc.
5 questions for AAPL
Ben Reitzes
Melius Research LLC
4 questions for AAPL
Krish Sankar
TD Cowen
4 questions for AAPL
Benjamin Reitzes
Melius Research
3 questions for AAPL
Sreekrishnan Sankarnarayanan
Wolfe Research, LLC
3 questions for AAPL
Aatif Malik
Citi
1 question for AAPL
Benjamin Bollin
Cleveland Research Company
1 question for AAPL
Recent press releases and 8-K filings for AAPL.
- Global tablet shipments projected to grow 9.8% to 162 million units in 2025, with Q4 volumes at 44 million units (+9.8% YoY).
- Apple led the market in Q4 2025 with 19.63 million iPads shipped (44.9% share; +16.5% YoY).
- Samsung’s Q4 shipments fell 9.2% to 6.44 million units, while Huawei and Xiaomi gained momentum with 14.8% and 10.1% growth, respectively.
- Omdia warns that after pandemic-driven peak demand and seasonal promotions, tablet market growth is nearing a slowdown, with intensified pressures expected in 2026.
- Apple plans mass production of in-house Baltra AI server chips in 2026.
- The company is developing proprietary AI-focused data centers to support Apple Intelligence, extending its hardware stack into the cloud.
- This strategy aims to enhance performance and sovereignty by reducing reliance on third-party cloud providers, controlling cost, security, and scalability.
- Apple’s iPhone ASP reached US$1,032 in Q4 2025, up 11.5% YoY as the premium iPhone 17 mix drove strong pricing power.
- iPhone shipments totaled 82.6 million units in Q4 2025, capturing 24.6% of global smartphone volume, a 10.6% year-over-year increase.
- For full-year 2025, Apple shipped 242.8 million iPhones, growing 9.9% YoY and securing 19.3% market share, marking its first annual lead in global smartphone shipments.
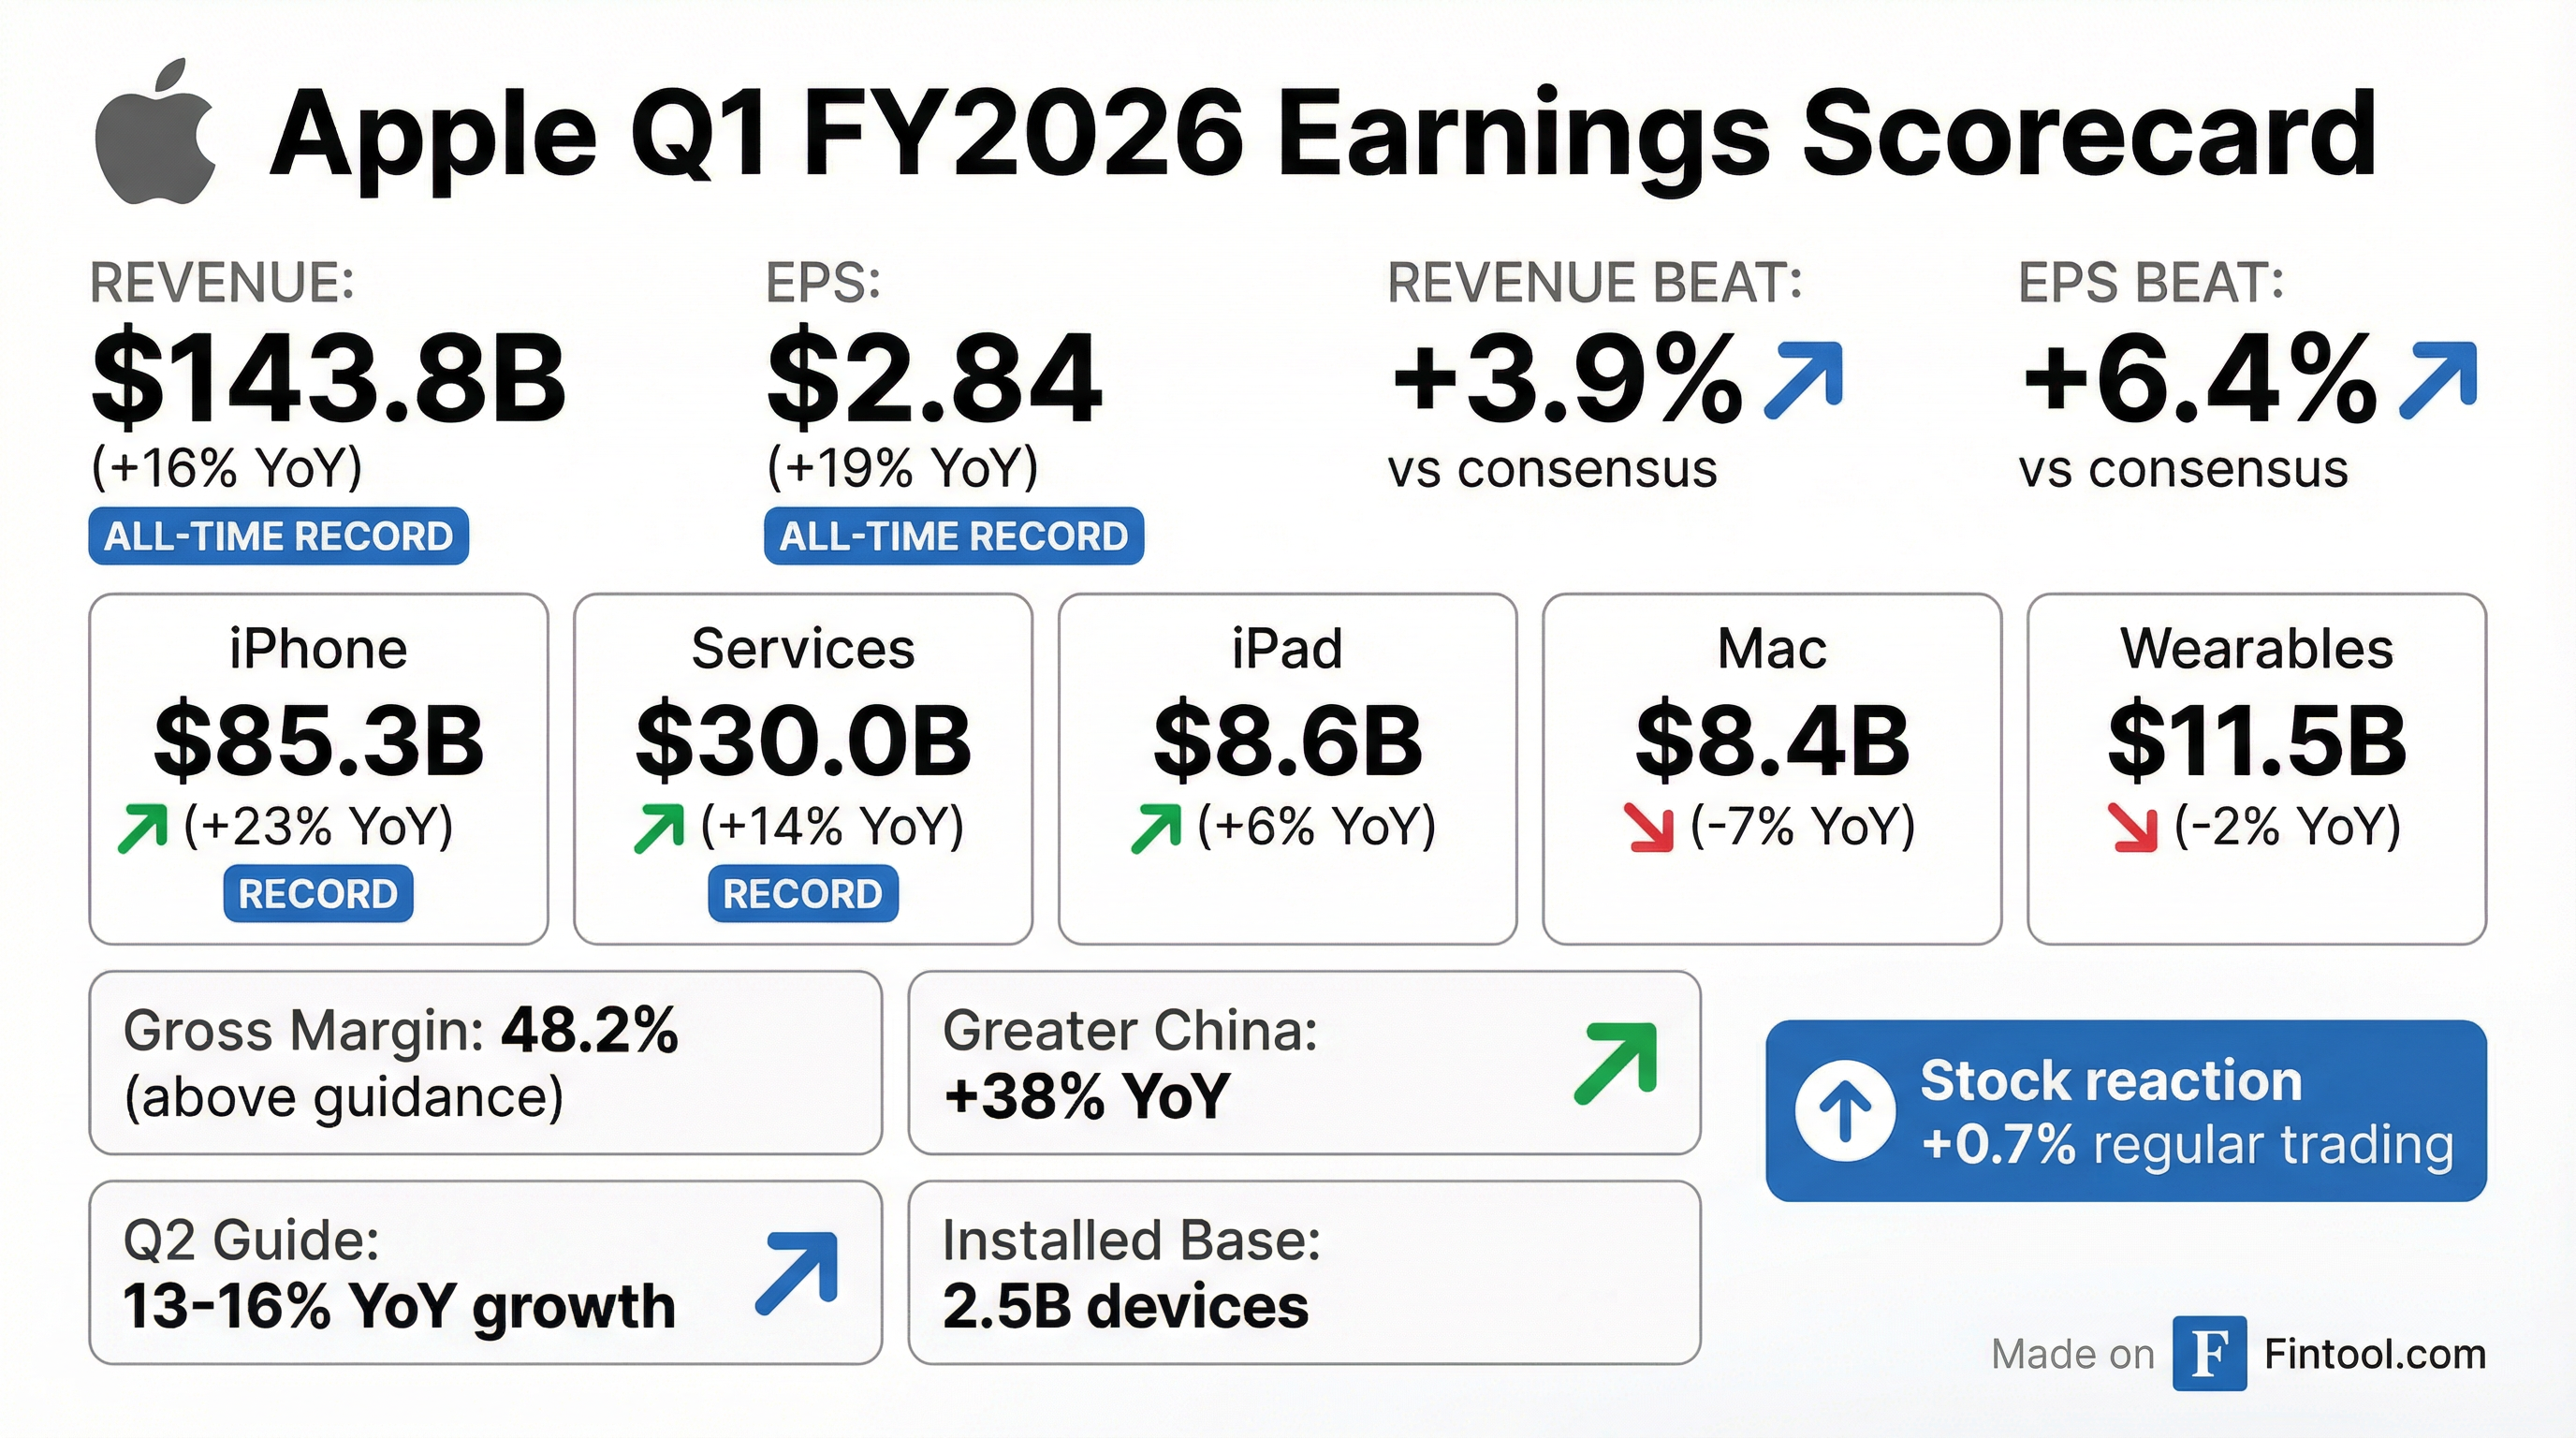
- Apple posted record $143.8 billion quarterly revenue, up 16% year over year, with iPhone sales hitting a record $85 billion, a 23% increase.
- Greater China revenue surged 38% to $25.5 billion, more than double Apple's overall growth, driven by strong iPhone 17 demand and in-store traffic.
- Services reached all-time highs, complementing robust hardware sell-through across regions.
- CEO Tim Cook highlighted India as a strategic growth market, achieving record quarterly revenue across iPhone, Mac, and iPad.
- Apple posted record fiscal Q1 2026 revenue of $143.8 billion and net profit of $42.1 billion (EPS $2.84)
- iPhone revenue rose 23% to $85.3 billion, driven by all-time unit performance and a rebound in Greater China
- Services revenue hit a record $30 billion, with the installed base topping 2.5 billion active devices
- Greater China revenue jumped 38% to $25.53 billion, transforming the region into a headline-strength market
- Declared a $0.26 quarterly dividend, issued no forward guidance, and emphasized AI investments, including partnerships like Q.ai
- Revenue of $143.8 billion (+16% YoY) and EPS of $2.84 (+19% YoY), both all-time quarterly records.
- iPhone revenue reached $85.3 billion (+23% YoY); Services revenue was $30 billion (+14% YoY); active device base surpassed 2.5 billion.
- Gross margin of 48.2%, up 100 bps sequentially; Q2 revenue expected to grow 13–16% YoY with gross margin of 48–49%.
- Returned nearly $32 billion to shareholders—including $25 billion in share repurchases—and ended Q1 with $145 billion in cash and marketable securities (net cash $54 billion).
- Board declared a quarterly dividend of $0.26 per share, payable February 12, 2026.
- Apple delivered $143.8 B revenue, up 16% YoY, marking its best quarter ever.
- iPhone revenue reached $85.3 B (+23% YoY; all-time record) and Services hit $30 B (+14% YoY; record in developed & emerging markets).
- Gross margin expanded to 48.2%, with net income of $42.1 B, EPS of $2.84 (+19% YoY), and operating cash flow of $53.9 B (all-time high).
- Active installed base surpassed 2.5 B devices, reaching an all-time high across all product categories and regions.
- For Q2 FY26, Apple guides 13–16% YoY revenue growth, 48–49% gross margin, $18.4–18.7 B in OpEx, and expects to return ~$32 B to shareholders (including $25 B buybacks and $3.9 B dividends); net cash stood at $54 B at quarter end.
- Revenue of $143.8 billion, up 16% year-over-year, and diluted EPS of $2.84, up 19% year-over-year.
- iPhone and Services revenues reached all-time highs, with Services revenue up 14% year-over-year.
- Generated nearly $54 billion in operating cash flow, enabling $32 billion returned to shareholders via buybacks and dividends.
- Board declared a $0.26 per share quarterly dividend, payable February 12, 2026.
- Installed base exceeded 2.5 billion active devices.
- Apple posted $143.8 billion in Q1 FY2026 revenue, up 16% year-over-year, and diluted EPS of $2.84, up 19%, both at all-time records.
- iPhone and Services achieved all-time revenue highs, with Services revenue growing 14% year-over-year.
- Generated nearly $54 billion in operating cash flow, enabling a return of almost $32 billion to shareholders.
- Declared a cash dividend of $0.26 per share, payable February 12, 2026, to shareholders of record as of February 9, 2026.
- Apple confirmed the acquisition of Israeli AI audio startup Q.ai for close to $2 billion, marking its second-largest deal after Beats.
- Q.ai’s technology uses machine-learning to read facial micromovements for “silent speech,” speaker identification, emotion and physiological signal assessment, and improved noise cancellation.
- Founders and leadership, including CEO Aviad Maizels, Yonatan Wexler, and Avi Barliya, will join Apple as part of the acquisition.
- The deal supports Apple’s device-level AI and spatial computing ambitions, with potential integration into AirPods, iPhone calls, Vision Pro, smart glasses, and AI wearables.
Fintool News
In-depth analysis and coverage of Apple.

Apple Brings Agentic Coding to Xcode 26.3, Integrating Claude and Codex

Apple Posts Record $143.8B Quarter on 'Staggering' iPhone Demand and China Rebound

Apple Reports Record Quarter: iPhone Sales Surge 23% to $85B as China Turnaround Stuns Wall Street

Apple Makes Second-Largest Acquisition Ever, Buying Israeli AI Startup Q.ai for ~$2 Billion

The $69M Options Swap: Inside Pelosi's Sophisticated Tax Play as Congress Moves to Ban Trading

Apple Elevates John Ternus to Design Chief, Cementing CEO Candidacy
Quarterly earnings call transcripts for Apple.
Ask Fintool AI Agent
Get instant answers from SEC filings, earnings calls & more