Earnings summaries and quarterly performance for Meta Platforms.
Executive leadership at Meta Platforms.
Board of directors at Meta Platforms.
Andrew Houston
Director
Charles Songhurst
Director
Dana White
Director
Dina Powell McCormick
Director
Hock Tan
Director
John Arnold
Director
John Elkann
Director
Marc Andreessen
Director
Nancy Killefer
Director
Patrick Collison
Director
Peggy Alford
Director
Robert Kimmitt
Lead Independent Director
Tony Xu
Director
Tracey Travis
Director
Research analysts who have asked questions during Meta Platforms earnings calls.
Brian Nowak
Morgan Stanley
10 questions for META
Eric Sheridan
Goldman Sachs
10 questions for META
Justin Post
Bank of America Corporation
10 questions for META
Mark Shmulik
Bernstein
9 questions for META
Douglas Anmuth
JPMorgan Chase & Co.
8 questions for META
Ronald Josey
Citigroup Inc.
7 questions for META
Ross Sandler
Barclays
7 questions for META
Youssef Squali
Truist Securities
7 questions for META
Mark Mahaney
Evercore ISI
6 questions for META
Kenneth Gawrelski
Wells Fargo & Company
5 questions for META
Doug Anmuth
J.P. Morgan
2 questions for META
Ken Gawrelski
Wells Fargo
2 questions for META
Ron Josey
Citi
2 questions for META
Recent press releases and 8-K filings for META.
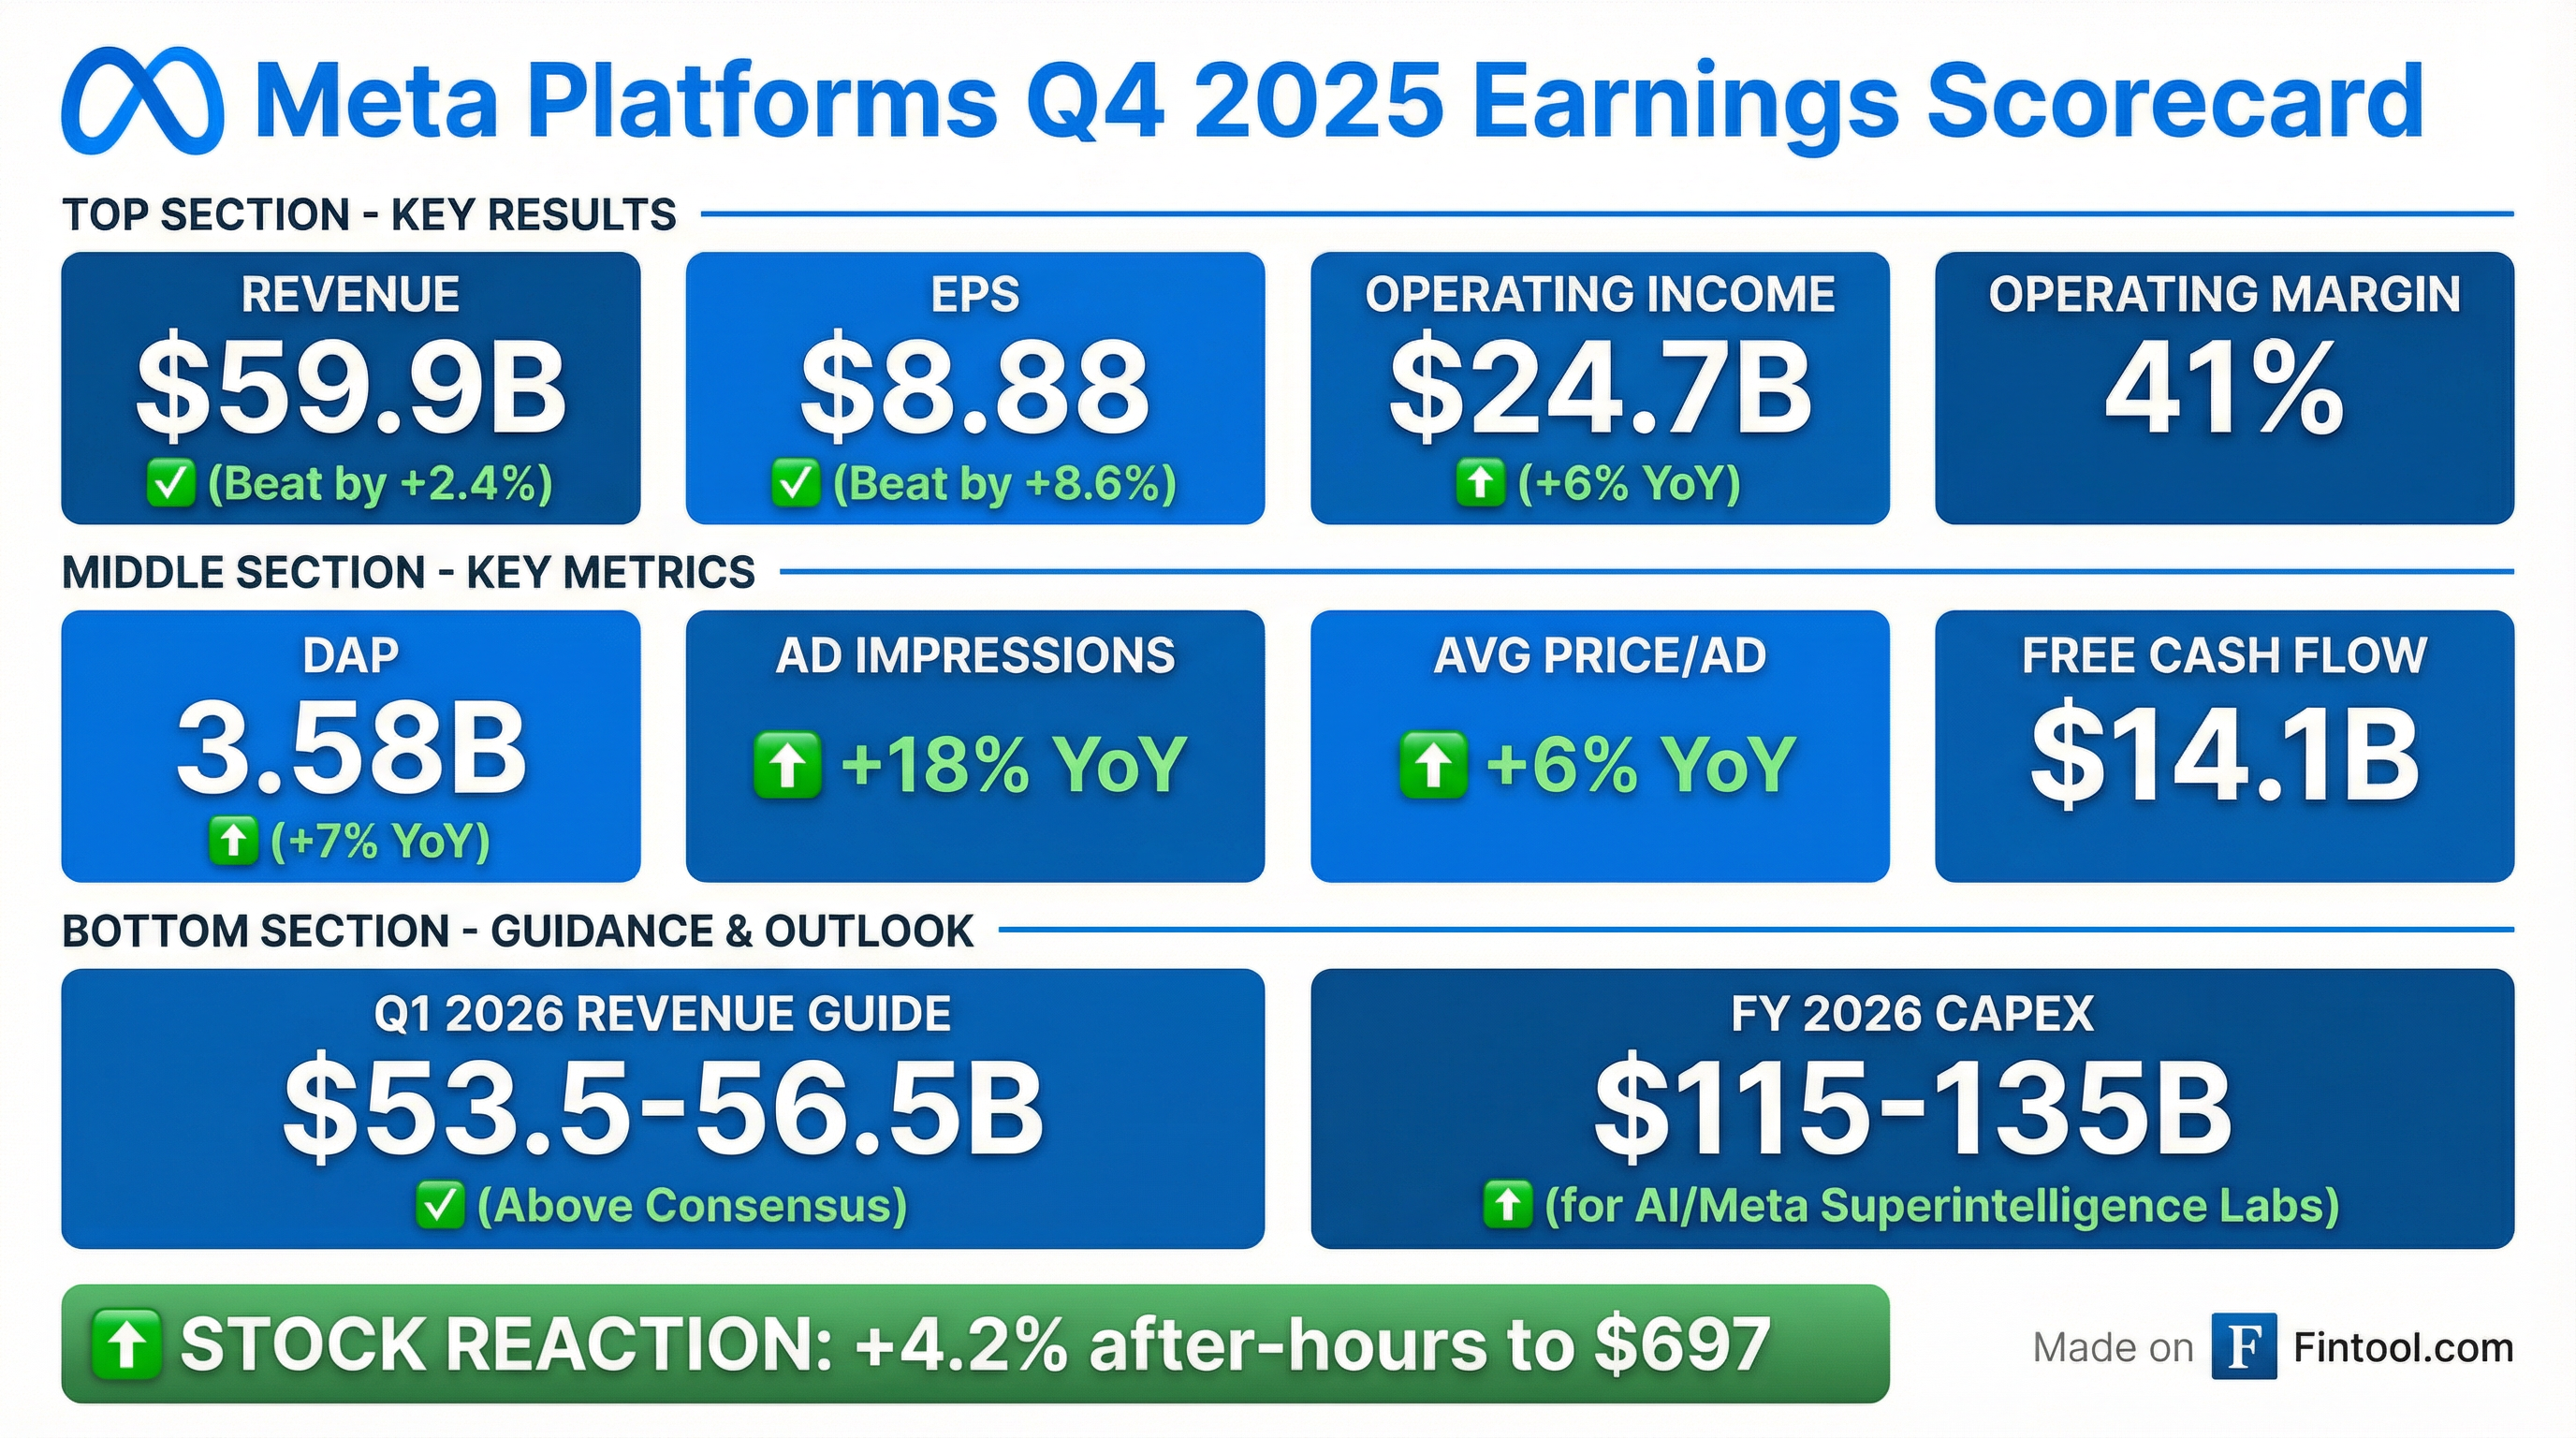
- 3.5 billion people used at least one Meta app daily in Q4 2025, including 2 billion daily actives on both Facebook and WhatsApp; strong holiday demand and AI-driven gains powered record performance.
- Q1 2026 total revenue is guided to $53.5 billion–$56.5 billion, full-year 2026 expenses to $162 billion–$169 billion, CapEx to $115 billion–$135 billion, and operating income above 2025 levels.
- Q4 2025 ad improvements: 3.5% lift in Facebook ad clicks, >1% gain in Instagram conversions, 3% boost from a new runtime model, 12% higher ads quality; WhatsApp paid messaging reached a $2 billion run rate and US click-to-message ads grew >50% YoY.
- Ongoing heavy investment in AI and infrastructure via MetaCompute and Meta Superintelligence Labs (MSL), with Reality Labs losses expected to remain at 2025 levels.
- Meta reported Q4 2025 total revenue of $59.9 billion with an operating margin of 41%.
- Net income was $22.8 billion, driving diluted EPS of $8.88.
- Free cash flow reached $14.1 billion in the quarter, up from $13.2 billion in Q4 2024.
- Family Daily Active People rose to 3.58 billion and average revenue per person was $16.56 in Q4 2025.
- Q4 total revenue was $59.9 billion, up 24% year-over-year; Family of Apps revenue reached $58.9 billion (+25%), while Reality Labs revenue declined 12% to $955 million.
- Operating income in Q4 was $24.7 billion (41% margin); net income was $22.8 billion or $8.88 per share.
- Meta highlighted a major AI acceleration, including record engagement gains from recommendation and generative media tools, the tripling of AI glasses sales, and expansion of Meta AI to over 200 markets.
- 2026 outlook: Q1 revenue guidance of $53.5 billion–$56.5 billion, full-year expenses of $162 billion–$169 billion, and CapEx of $115 billion–$135 billion, with operating income expected above 2025 levels.
- Meta forecasts Q1 2026 revenue of $53.5–56.5 billion, with a 4% FX tailwind year-over-year
- Full-year 2026 expenses expected at $162–169 billion, driven by infrastructure and talent; capital expenditures at $115–135 billion
- Operating income in 2026 projected to exceed 2025 levels, with a full-year tax rate of 13–16%
- Reality Labs losses in 2026 expected to match 2025 (peak year) amid heavy investment in AI infrastructure, including Meta Compute
- Meta delivered Q4 revenue of $59.89 B (+24% YoY) and full-year revenue of $200.97 B (+22% YoY).
- Q4 net income was $22.77 B (EPS $8.88, +9% YoY); full-year net income was $60.46 B (EPS $23.49).
- Total costs and expenses totaled $35.15 B in Q4 (+40% YoY) and $117.69 B for the year (+24% YoY), with operating margins of 41% for both periods.
- Q4 capital expenditures were $22.14 B and free cash flow was $14.08 B; FY capex was $72.22 B and free cash flow was $43.59 B.
- For Q1 2026, revenue is guided to $53.5–56.5 B; full-year 2026 expenses are expected at $162–169 B, with capital expenditures of $115–135 B and operating income above 2025 levels.
- Revenue was $59.89 billion in Q4 (+24% YoY) and $200.97 billion for FY 2025 (+22%).
- Net income was $22.77 billion in Q4 (+9% YoY) with diluted EPS of $8.88 (+11%), and FY net income was $60.46 billion (–3%) with diluted EPS of $23.49 (–2%).
- Free cash flow was $14.08 billion in Q4 and $43.59 billion for the full year, while capital expenditures were $22.14 billion in Q4 and $72.22 billion for FY 2025.
- Cash, cash equivalents, and marketable securities totaled $81.59 billion as of December 31, 2025, against long-term debt of $58.74 billion.
- Guidance for Q1 2026 revenue is $53.5–56.5 billion, full-year expenses $162–169 billion, and capex $115–135 billion.
- Solos Technology filed a federal lawsuit in Massachusetts seeking multibillion-dollar damages and an injunction against Meta, EssilorLuxottica and Oakley for alleged infringement of patents on core smart-glasses technologies.
- The suit targets the Ray-Ban Meta Wayfarer Gen 1 and subsequent models, threatening Meta’s roughly $3.5 billion investment and partnership with EssilorLuxottica in Ray-Ban smart glasses.
- Solos alleges willful infringement via knowledge transfer, citing a former Solos research lead who joined Meta and testing exposure with Oakley executives.
- Potential outcomes include large damages awards, mandatory redesigns or injunctions that could delay Reality Labs’ AR/VR hardware rollout; EssilorLuxottica shares rose slightly on the news.
- On January 20, 2026, the FTC filed a notice of appeal challenging a November 2025 D.C. district court decision that cleared Meta of unlawfully maintaining a monopoly through its acquisitions.
- Judge Boasberg held that Meta lacks monopoly power, citing strong competition from platforms such as YouTube and TikTok.
- The FTC contends Meta preserved dominance by its “killer acquisition” strategy, notably buying Instagram for $1 billion in 2012 and WhatsApp for $19 billion in 2014.
- A successful appeal could impose structural remedies, including unwinding those acquisitions, and set a precedent for Big Tech antitrust enforcement.
- The UK Gambling Commission accused Meta of turning a blind eye to illegal gambling ads on Facebook and Instagram after uncovering unlicensed operators targeting UK users via its public ad library.
- Regulators found ads explicitly referencing "not on GamStop," signaling evasion of Britain’s self-exclusion scheme and broader criminality.
- Meta said it removes ads once notified and suggested regulators leverage its AI detection tools, but the Commission reported very limited progress and urged proactive enforcement.
- Meta shares traded near $620 as investors processed the watchdog’s remarks.
- Meta plans to spend over $100 billion in 2026 capex on a global AI data-center buildout, raising near-term cash-flow and capital-intensity concerns.
- CEO Mark Zuckerberg hired Dina Powell McCormick as President and Vice Chair to secure partnerships with governments and sovereign funds.
- Despite heavy AI spending, Meta’s core business maintains high operating margins and robust revenue growth, with Wall Street holding a Strong Buy consensus and lofty price targets.
- Meta formed a partnership with Wikipedia to enhance AI training data as part of its broader AI capability expansion.
- AI data-center vendors like Lumentum have surged, with shares up 328% over the past year on rising demand and improved margins.
Fintool News
In-depth analysis and coverage of Meta Platforms.

Meta Commits to $135 Billion AI Bet, Shattering CapEx Records as Q4 Earnings Soar

Meta Commits $6 Billion to Corning for AI Data Center Fiber

Meta Bets on Subscriptions: Premium Tiers Coming to Instagram, Facebook, and WhatsApp

EU Opens Formal Investigation Into X Over Grok Deepfakes, Escalating Global Regulatory Crackdown

Solos Sues Meta for 'Multiple Billions' Over Ray-Ban Smart Glasses, Alleges Years of Corporate Espionage

Meta's Superintelligence Lab Delivers First AI Models, CTO Says 'Very Good' Progress
Quarterly earnings call transcripts for Meta Platforms.
Ask Fintool AI Agent
Get instant answers from SEC filings, earnings calls & more