Earnings summaries and quarterly performance for PPG INDUSTRIES.
Executive leadership at PPG INDUSTRIES.
Timothy Knavish
Chairman and Chief Executive Officer
Anne Foulkes
Senior Vice President and General Counsel
Chancey Hagerty
Senior Vice President, Automotive Refinish Coatings
Henrik Bergström
Senior Vice President, Architectural Coatings, Latin America, EMEA and Asia Pacific
Joseph Gette
Senior Vice President, General Counsel and Secretary (effective Jan 1, 2026)
Vincent Morales
Senior Vice President and Chief Financial Officer
Board of directors at PPG INDUSTRIES.
Catherine Smith
Director
Christopher Roberts III
Director
Gary Heminger
Director
Guillermo Novo
Director
Kathleen Ligocki
Director
Kathy Fortmann
Director
Leon Topalian
Director
Melanie Healey
Director
Michael Lamach
Lead Independent Director
Michael Nally
Director
Research analysts who have asked questions during PPG INDUSTRIES earnings calls.
Arun Viswanathan
RBC Capital Markets
9 questions for PPG
David Begleiter
Deutsche Bank
9 questions for PPG
Ghansham Panjabi
Robert W. Baird & Co.
9 questions for PPG
John McNulty
BMO Capital Markets
9 questions for PPG
Kevin McCarthy
Vertical Research Partners
9 questions for PPG
Michael Sison
Wells Fargo
9 questions for PPG
Patrick Cunningham
Citigroup
9 questions for PPG
John Ezekiel Roberts
Mizuho Securities
8 questions for PPG
Vincent Andrews
Morgan Stanley
8 questions for PPG
Frank Mitsch
Fermium Research
7 questions for PPG
Jeffrey Zekauskas
JPMorgan Chase & Co.
7 questions for PPG
Josh Spector
UBS Group
7 questions for PPG
Chris Parkinson
Wolfe Research, LLC
6 questions for PPG
James Hooper
AB Bernstein
6 questions for PPG
Laurence Alexander
Jefferies
6 questions for PPG
Aleksey Yefremov
KeyBanc Capital Markets
5 questions for PPG
Duffy Fischer
Goldman Sachs
4 questions for PPG
Laurent Favre
BNP Paribas
4 questions for PPG
Matthew Deyoe
Bank of America
4 questions for PPG
Mike Harrison
Seaport Research Partners
4 questions for PPG
Aron Ceccarelli
Berenberg
3 questions for PPG
Christopher Parkinson
Wolfe Research
3 questions for PPG
Michael Harrison
Seaport Research Partners
3 questions for PPG
Patrick Fischer
Goldman Sachs
3 questions for PPG
Aziza Gazieva
Fermium Research
2 questions for PPG
Eric Boyes
Evercore Inc.
2 questions for PPG
Joshua Spector
UBS
2 questions for PPG
Michael Leithead
Barclays
2 questions for PPG
Ryan Weis
KeyBanc Capital Markets
2 questions for PPG
Steve Byrne
Bank of America
2 questions for PPG
Daniel Rizzo
Jefferies
1 question for PPG
Jaideep Pandya
On Field Research
1 question for PPG
Jeff Zekauskas
JPMorgan
1 question for PPG
Ryan
B. Riley
1 question for PPG
Steven Haynes
Morgan Stanley
1 question for PPG
Recent press releases and 8-K filings for PPG.
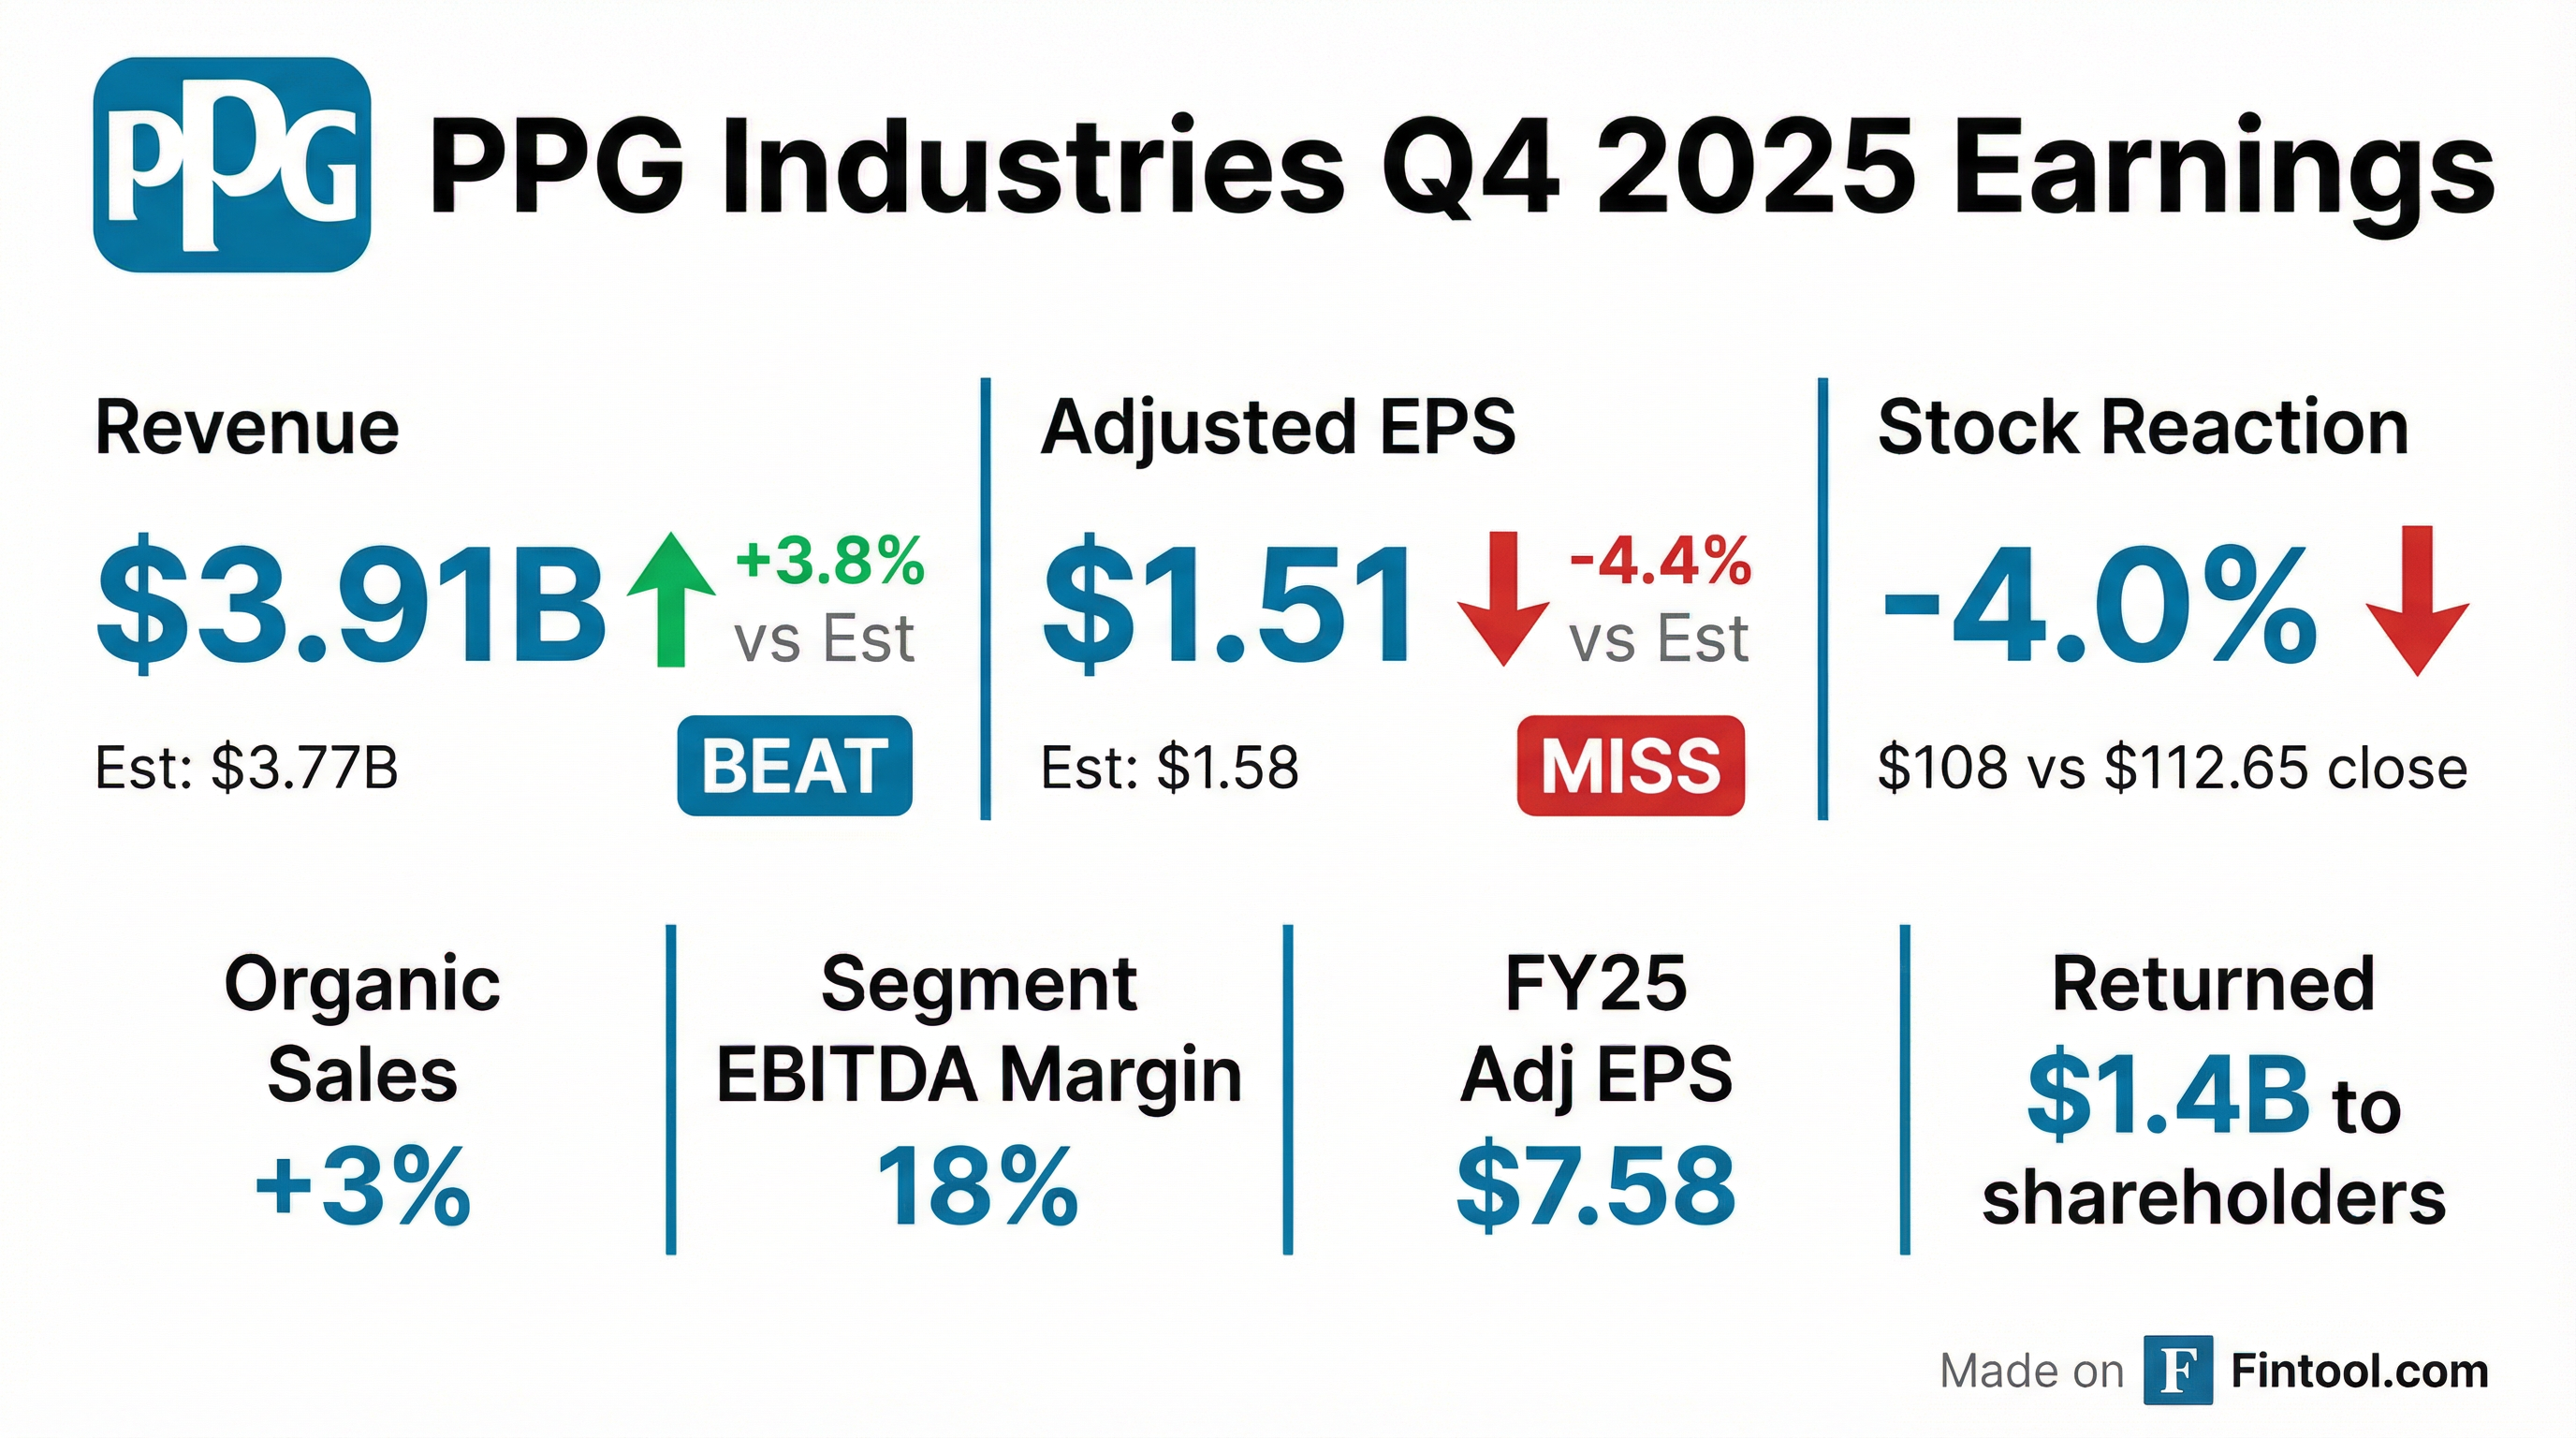
- PPG delivered FY 2025 net sales of $15.9 B (2% organic growth) and adjusted EPS of $7.58, with a 19% segment EBITDA margin; in Q4, net sales rose 5% to $3.9 B (3% organic) and adjusted EPS was $1.51.
- The company generated $1.9 B of operating cash flow (up $500 M YoY) for a 5% free cash flow yield, and returned $1.4 B to shareholders via $630 M in dividends and $790 M in share repurchases; it closed the year with $2.2 B in cash, $5.1 B net debt, and invested $780 M in capex.
- Q4 segment performance: Global Architectural Coatings net sales of $951 M (+8%, 2% organic), Performance Coatings net sales of $1.3 B (+5%), and Industrial Coatings net sales of $1.6 B (+3%, 5% volume growth); Q4 segment EBITDA margin was 18%.
- For 2026, PPG expects organic sales growth of flat to low single-digit, EPS growth of mid-single-digit at midpoint, flat raw material costs, and $50 M in operational cost savings, with stronger EPS in H2 vs. H1.
- PPG reported Q4 2025 net sales of $3.9 billion (up 5% YoY), with 3% organic growth, an 18% segment EBITDA margin, and $1.51 adjusted EPS; Aerospace coatings hit record sales and Automotive OEM sales rose 6%.
- For full year 2025, net sales reached $15.9 billion (+ 2% organic), adjusted EPS was $7.58, and cash from operations was $1.9 billion (+ $500 million YoY), delivering a 5% free cash flow yield and returning $1.4 billion to shareholders via $630 million in dividends and $790 million in share repurchases.
- The company ended 2025 with $2.2 billion in cash, net debt of $5.1 billion, invested $780 million in capital expenditures, and plans to reduce growth capex to ~ 3% of sales by 2027.
- 2026 guidance anticipates flat to low single-digit organic sales growth, flat raw material costs, $100 million of Industrial Coatings share gains, $50 million of incremental cost savings, and mid-single-digit % EPS growth at the midpoint.
- Q4 net sales of $3.9 billion, organic sales up 3%, adjusted EPS of $1.51 and Segment EBITDA margin of 18%.
- Automotive OEM net sales +6%, record fourth-quarter aerospace coatings sales and earnings, driven by share gains across segments.
- Full-year 2025 net sales of $15.9 billion, adjusted EPS of $7.58, and Segment EBITDA margin of 19%.
- Returned $1.4 billion to shareholders in 2025 via dividends (~$630 million) and share repurchases ($790 million), including ~$100 million in Q4.
- 2026 guidance: Q1 organic sales flat to +MSD across segments, segment EBITDA margin down 50–150 bps, corporate expense $90–100 million, and capex of $650–700 million for full year.
- Full-year 2025 net sales of $15.9 billion (+2% organic), adjusted EPS $7.58, operating cash flow $1.9 billion, free cash flow yield 5%, $1.4 billion returned to shareholders
- Q4 2025 net sales $3.9 billion, +5% year-over-year, 3% organic growth, driven by record aerospace coatings, Automotive OEM +6%, high single-digit growth in Latin America architectural coatings; Q4 adjusted EPS $1.51, segment EBITDA margin 18%
- Strong year-end financial position with $2.2 billion in cash, net debt $5.1 billion, $700 million debt maturing Q1 2026; 2025 capital expenditures $780 million
- 2026 guidance: organic sales growth flat to low single-digit, flat raw material costs, $50 million in operational cost savings, EPS growth mid-single-digit% at midpoint (flat to low-single digit H1; high-single digit H2)
- PPG’s Q4 2025 net sales were $3.9 billion, up 5% YoY, with 3% organic sales growth driven by higher volumes and pricing.
- Q4 2025 reported EPS was $1.34 and adjusted EPS was $1.51 from continuing operations.
- Full-year 2025 net sales totaled $15.9 billion (flat YoY); reported EPS was $6.92, adjusted EPS was $7.58, and operating cash flow rose to $1.9 billion, up over $500 million YoY.
- PPG returned $1.4 billion to shareholders in 2025 through $790 million of share repurchases (including $100 million in Q4) and $630 million of dividends.
- For 2026, PPG guides to organic sales growth flat to low single-digit and adjusted EPS in the range of $7.70–$8.10.
- Fourth-quarter net sales of $3.9 billion, 3% organic growth, reported EPS $1.34 and adjusted EPS $1.51; repurchased $100 million of stock.
- Full-year net sales of $15.9 billion, 2% organic growth, reported EPS $6.92 and adjusted EPS $7.58; operating cash flow $1.9 billion and $1.4 billion returned to shareholders.
- Segment margin of 17% and segment EBITDA margin of 19% for full-year 2025.
- 2026 outlook: organic sales growth flat to low single-digit and EPS growth mid-single-digit.
- PPG Industries completed an offering of $700 million 4.375% Senior Notes due March 15, 2031, issued under its March 18, 2008 indenture as supplemented by the first and thirteenth supplemental indentures.
- The notes bear interest at 4.375%, payable semi-annually on March 15 and September 15, are callable with a make-whole redemption prior to February 15, 2031, redeemable at par thereafter, and include a change-of-control repurchase at 101% of principal plus accrued interest.
- PPG sold the notes to underwriters at 98.970% of par (public offering at 99.570%), with a yield to maturity of 4.467% and a spread of T+75 bps to the September 30, 2030 Treasury.
- Net proceeds will be used for general corporate purposes, including repayment of existing indebtedness, working capital, capital expenditures, and potential acquisitions or investments.
- Third consecutive quarter of sales volume growth; net sales of $4.082 billion and 2% organic sales growth year-over-year in 3Q 2025.
- Performance Coatings delivered record aerospace sales with 2% organic growth and a 21.7% EBITDA margin (-280 bps) in 3Q 2025.
- Industrial Coatings net sales were $1.656 billion, with volume growth of 4% and a segment EBITDA margin of 17.0% (+180 bps) in 3Q 2025.
- Cash position of $1.9 billion, net debt of $5.4 billion (2.0× LTM EBITDA), and $310 million returned to shareholders in 3Q 2025.
- 4Q 2025 guidance: segment organic sales expected to be flat to +LSD; adjusted EPS flat to +LSD; raw material cost inflation in low-single digits.
- Delivered 2% organic sales growth, marking a third consecutive quarter of volume gains, and achieved a record Q3 adjusted EPS of $2.13 (+5% YoY).
- Performance coatings saw aerospace coatings deliver double-digit organic growth with record sales and earnings, protective & marine coatings recorded a 10th straight quarter of volume growth, while automotive refinish slipped by double digits amid U.S. collision-claims destocking.
- Global architectural coatings posted mid single-digit organic growth in Mexico and Latin America, flat sales in Europe, and expanded EBITDA margins through pricing and cost controls despite lower volumes and divestitures.
- Committed over $0.5 billion in near-term OpEx and CapEx to expand aerospace capacity—including a new 2027 facility—and anticipates aerospace revenues to grow at a mid- to high-single-digit CAGR over the next three years.
- Outlook for 2026 includes continued refinish normalization into mid-2026, a muted industrial backdrop offset by self-help cost actions, pricing support, and share gains; aerospace CapEx is expected to peak in 2025 and then trend toward 3% of sales.
- Achieved 2% organic sales growth and record Q3 EPS of $2.13, up 5% year-over-year.
- Performance coatings delivered record net sales with 2% organic growth; aerospace coatings grew double-digit with order backlog rising to $310 million, and protective & marine coatings saw double-digit growth for the 10th consecutive quarter.
- Industrial coatings volumes rose 4%, led by automotive OEM net sales up 8% and packaging coatings growing by a double-digit percentage, driving 12% segment EBITDA growth.
- Deployed capital including $150 million in share repurchases and $160 million in dividends (totaling $1.2 billion YTD), and updated full-year adjusted EPS guidance to $7.60–7.70.
- Committed over $0.5 billion in additional aerospace investments through 2026 to expand capacity, including a new manufacturing facility slated for 2027, targeting mid-to-high single-digit sales CAGR in aerospace.
Quarterly earnings call transcripts for PPG INDUSTRIES.
Ask Fintool AI Agent
Get instant answers from SEC filings, earnings calls & more