Earnings summaries and quarterly performance for EQUIFAX.
Executive leadership at EQUIFAX.
Mark W. Begor
Chief Executive Officer
Chad M. Borton
Executive Vice President, President, Workforce Solutions
Jamil Farshchi
Executive Vice President, Chief Technology Officer and Chief Information Security Officer
John W. Gamble, Jr.
Executive Vice President, Chief Financial Officer and Chief Operations Officer
Julia A. Houston
Executive Vice President and Chief Legal Officer
Patricio Remon
President, Equifax International
Board of directors at EQUIFAX.
Audrey Boone Tillman
Director
Barbara A. Larson
Director
G. Thomas Hough
Director
John A. McKinley
Director
Karen L. Fichuk
Director
Mark L. Feidler
Independent Chairman of the Board
Melissa D. Smith
Director
Robert D. Marcus
Director
Scott A. McGregor
Director
Research analysts who have asked questions during EQUIFAX earnings calls.
Kelsey Zhu
Autonomous Research
8 questions for EFX
Scott Wurtzel
Wolfe Research
8 questions for EFX
Toni Kaplan
Morgan Stanley
8 questions for EFX
Andrew Steinerman
JPMorgan Chase & Co.
7 questions for EFX
Craig Huber
Huber Research Partners
7 questions for EFX
Kevin McVeigh
Credit Suisse Group AG
7 questions for EFX
Faiza Alwy
Deutsche Bank
6 questions for EFX
Shlomo Rosenbaum
Stifel, Nicolaus & Company, Incorporated
6 questions for EFX
Andrew Nicholas
William Blair & Company
5 questions for EFX
Arthur Truslove
Citi
5 questions for EFX
Jason Haas
Wells Fargo
5 questions for EFX
Kyle Peterson
Needham & Company
5 questions for EFX
Simon Clinch
Redburn Atlantic
5 questions for EFX
Jeff Meuler
Robert W. Baird & Co.
4 questions for EFX
Jeffrey Meuler
Robert W. Baird & Co. Incorporated
4 questions for EFX
Surinder Thind
Jefferies Financial Group
4 questions for EFX
Ashish Sabadra
RBC Capital Markets
3 questions for EFX
George Tong
Goldman Sachs
3 questions for EFX
Keen Fai Tong
Goldman Sachs Group Inc.
3 questions for EFX
Manav Patnaik
Barclays
3 questions for EFX
Matthew O'Neill
Financial Technology Partners
3 questions for EFX
Ryan Griffin
BMO Capital Markets
3 questions for EFX
Brendan Lynch
Barclays
2 questions for EFX
David Bother
RBC Capital Markets
2 questions for EFX
David Paige
RBC Capital Markets
2 questions for EFX
Jimmy
Wells Fargo & Company
2 questions for EFX
Owen Lau
Oppenheimer & Co. Inc.
2 questions for EFX
Rayna Kumar
Oppenheimer & Co. Inc.
2 questions for EFX
Simon Alistair Clinch
Redburn Atlantic
2 questions for EFX
Zach Lasich
FT Partners
2 questions for EFX
Andrew Stein
FT Partners
1 question for EFX
Brandon Barron
Needham & Company, LLC
1 question for EFX
Brendan Popson
Barclays
1 question for EFX
David Paige Papadogonas
RBC Capital Markets
1 question for EFX
Joshua Dennerlein
BofA Securities
1 question for EFX
Kwun Sum Lau
Oppenheimer
1 question for EFX
Recent press releases and 8-K filings for EFX.
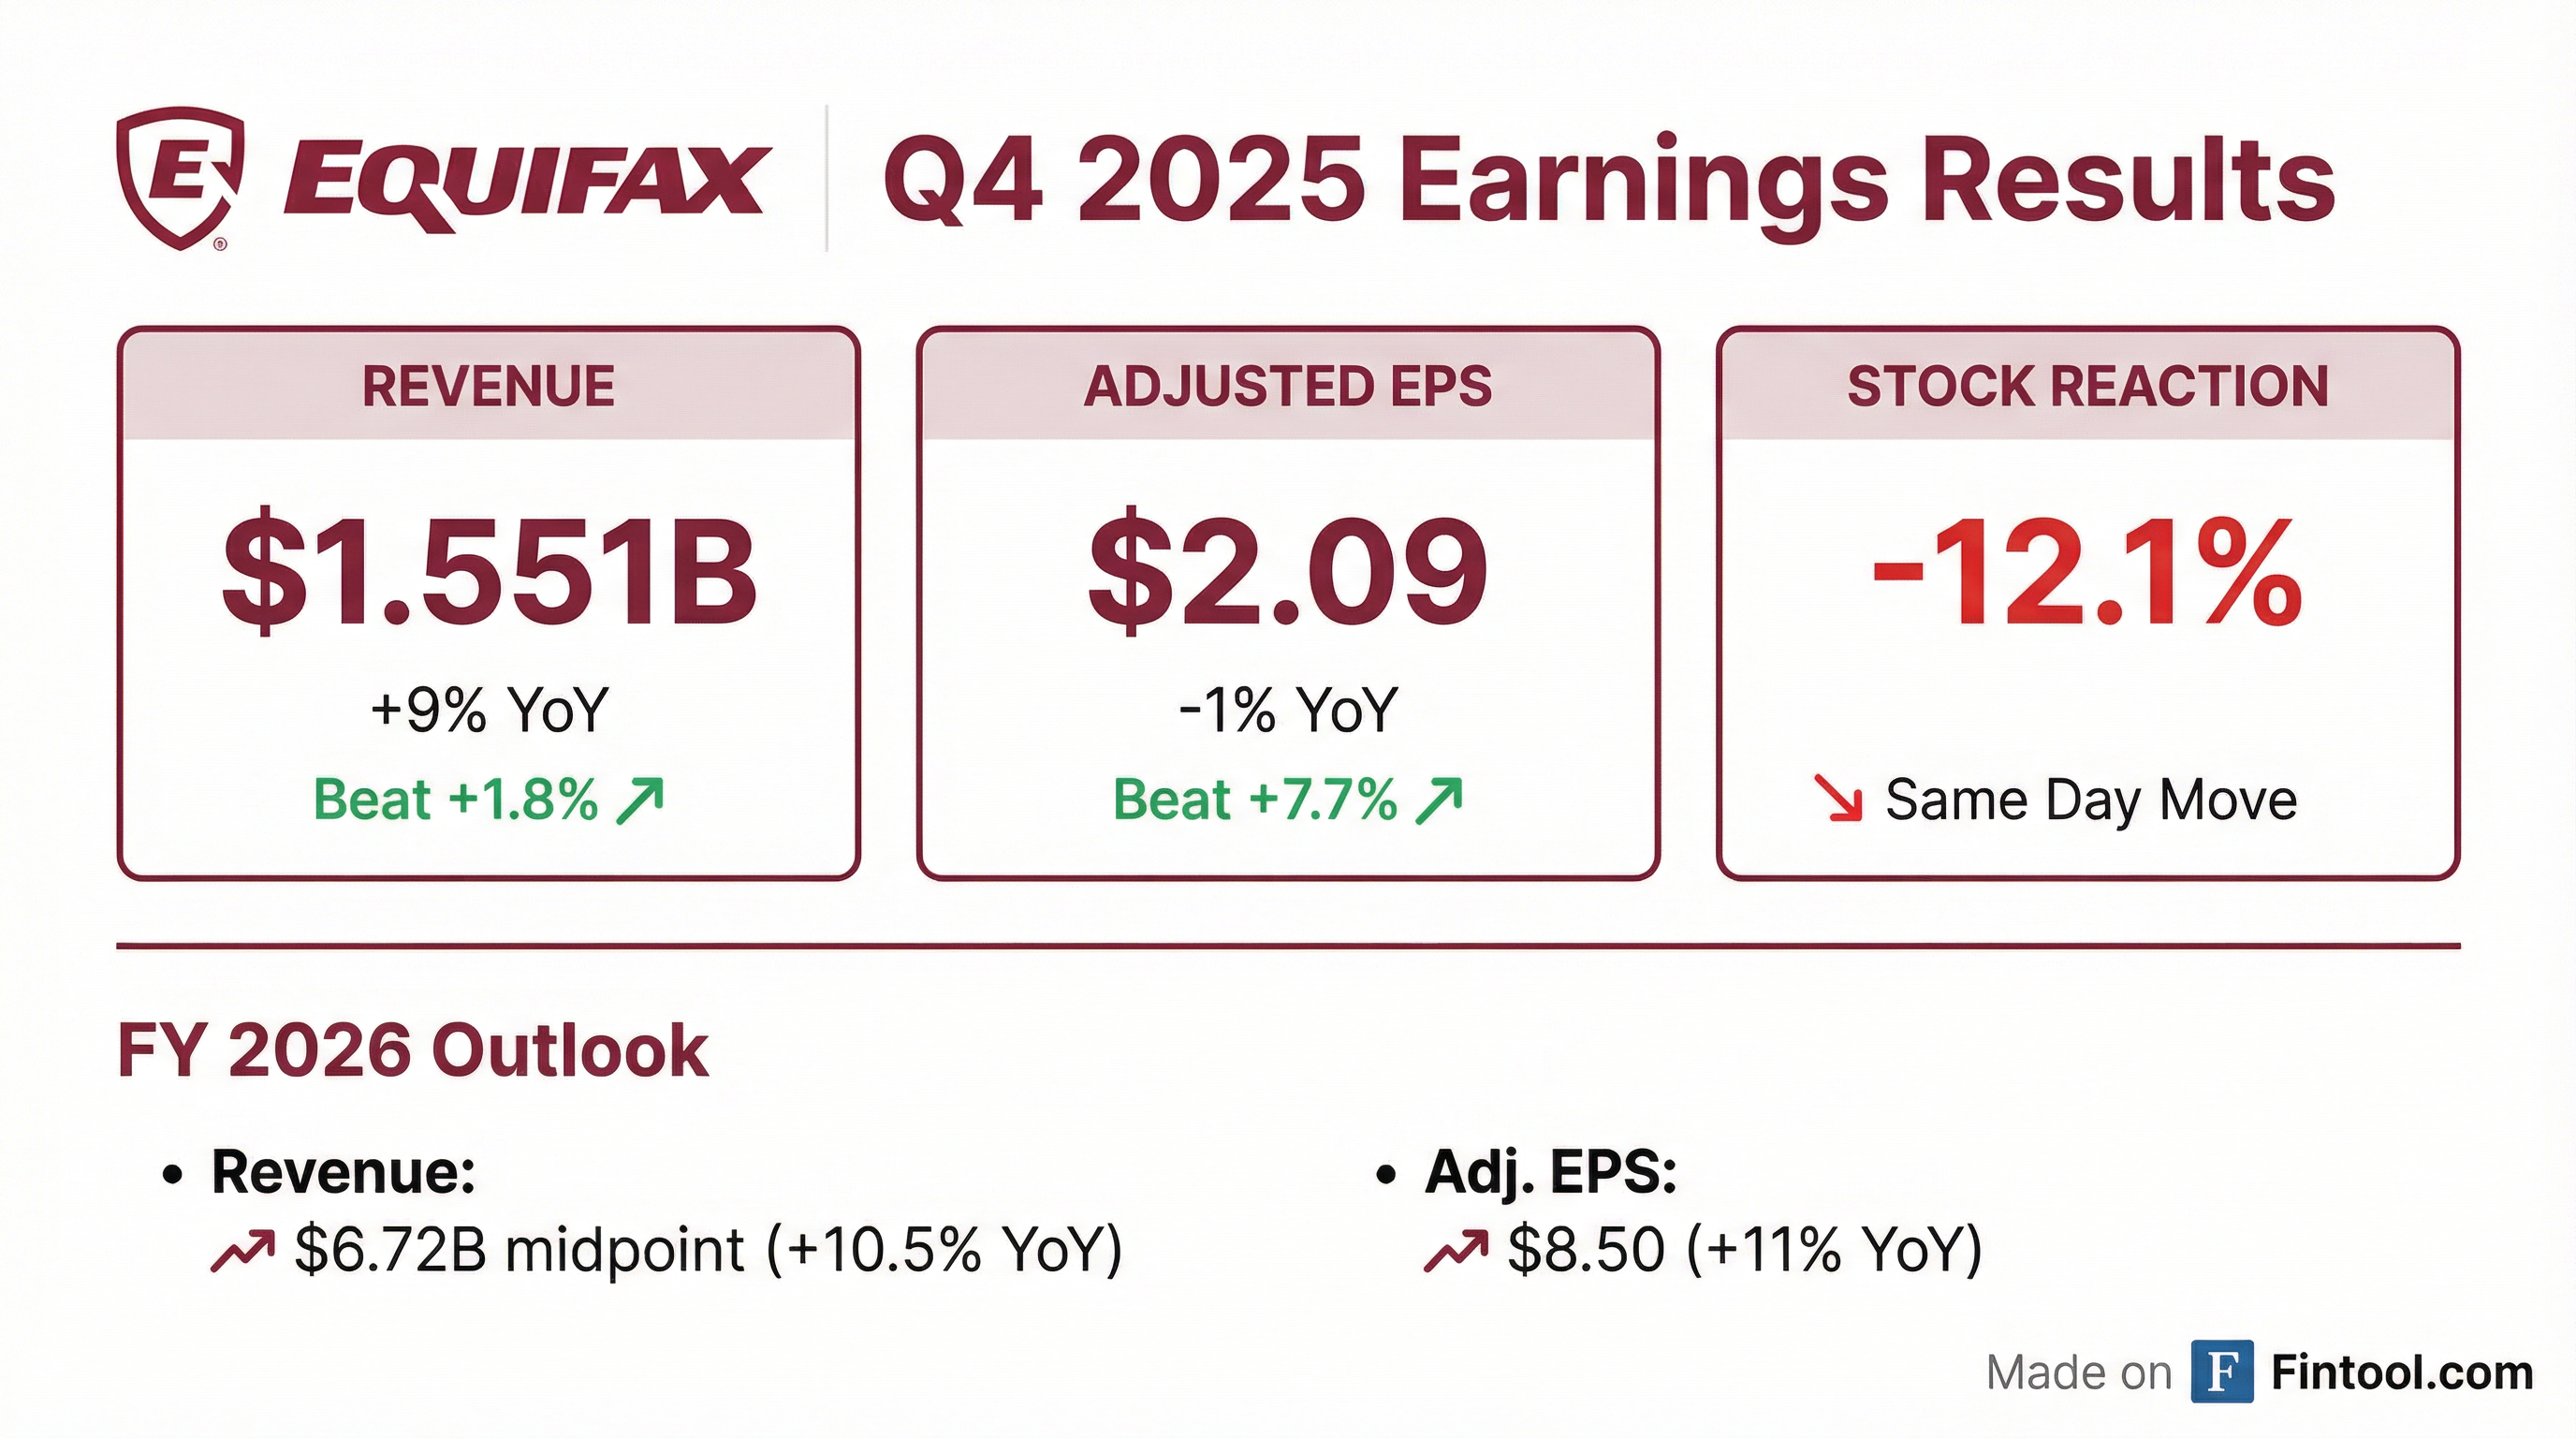
- Equifax reported Q4 revenue of $1.551 billion, up 9% year-over-year, topping estimates; adjusted EPS was $2.09 (beat) while GAAP EPS of $1.44 missed.
- Strong segment performance: 20% U.S. Mortgage revenue growth, 12% U.S. Information Solutions growth (including 33% Mortgage), and 5% local-currency international growth.
- Free cash flow margin improved to 22%, and the company returned $561 million to shareholders, including $500 million for repurchasing 2.3 million shares under its $3 billion buyback program.
- Management guided Q1 revenue of $1.60–$1.63 billion and 2026 revenue of $6.72 billion with adjusted EPS of $8.50, citing headwinds in U.S. mortgage and hiring markets.
- Q4 revenue rose 9% y/y, generating Adj EPS $2.09, $0.06 above October guidance; Adj EBITDA margin 32.8%
- FY 2025 revenue reached $6.075 B (+7%), Adj EPS $7.65 (+5%), Free Cash Flow $1.13 B (+40%), with cash conversion 120%
- Returned $561 M to shareholders in Q4 via $500 M buybacks and $61 M dividends; $1.2 B returned in 2025
- 2026 guidance: revenue $6.66–6.78 B (+9.6–11.6%), Adj EPS $8.30–8.70 (+8.5–13.7%), Adj EBITDA margin 31.3–31.8%
- Revenue rose 9% to $1.551 B, exceeding October guidance by $30 M, driven by strong workforce solutions and USIS mortgage performance.
- EBITDA of $508 M with a 32.8% margin, and EPS of $2.09, $0.06 above the midpoint of guidance.
- Free cash flow of $1.13 B with 120% conversion; $1.2 B returned to shareholders in 2025, including $927 M in share repurchases and $233 M in dividends.
- 2026 guidance calls for 10.6% reported revenue growth (10% constant currency; 7% ex-FICO), 10% EBITDA growth to $2.12 B, EPS of $8.50, and over $1 B free cash flow.
- 2025 full-year results: Revenue of $6.075 B (up 7% reported & organic constant currency), EPS of $7.65, and free cash flow of $1.13 B, all above guidance and within the 7–10% long-term revenue growth framework.
- Segment performance: Workforce Solutions revenue +6% with 51.5% EBITDA margin (Q4 +9%); USIS revenue +10% with margins up 70 bp; International constant-$ revenue +6% with ~100 bp margin expansion; cloud migration on track for mid-2026 completion.
- Innovation & product rollouts: Achieved a record 15% new-product vitality (~$900 M revenue) powered by 90% cloud-native operations and AI; launched Twin Indicator income & employment data solution in mortgage, auto, and card markets.
- 2026 guidance: Revenue expected +10.6% reported (+10% CC) with EPS of $8.50 (+11%) and ≥100% free cash flow conversion; ex-FICO growth ~7% with EBITDA margin expansion of 75 bp, while FICO mortgage royalties will rise to ~6% of revenue, weighing on reported margins.
- Full-year 2025 revenue of $6.075 billion, EPS of $7.65, and free cash flow of $1.13 billion; revenue +7% organic on constant currency basis.
- Q4 2025 EBITDA was $508 million (32.8% margin) and EPS was $2.09; returned $561 million to shareholders, including $500 million in share repurchases.
- 2026 guidance: total revenue +10.6% (reported) / +10% (constant currency) with ex-FICO growth of ~7%; EBITDA of $2.12 billion (+10%) and EPS of $8.50; free cash flow >$1 billion.
- FICO mortgage score royalties pass-through will rise from ~3% to ~6% of revenue in 2026, reducing reported EBITDA margins by >200 bps, while ex-FICO margins are expected to expand by 75 bps.
- Equifax reported fourth-quarter 2025 revenue of $1.551 billion, up 9% year-over-year, and diluted EPS of $1.44 versus $1.39 in Q4 2024.
- Full-year 2025 revenue totaled $6.075 billion, up 7%, with diluted EPS of $5.32 versus $4.84 in 2024.
- By segment in Q4, Workforce Solutions revenue grew 9% to $652.2 million, U.S. Information Solutions (USIS) grew 12% to $526.9 million, and International grew 7% to $371.5 million.
- The company returned $561 million of cash to shareholders in Q4, including a $500 million share repurchase (2.3 million shares) under its $3 billion buyback program.
- For full-year 2026, Equifax expects revenue of $6.72 billion at the midpoint (≈10.5% growth) and Adjusted EPS of $8.50, assuming a modest downturn in U.S. mortgage markets.
- Equifax delivered $1.551 billion in fourth-quarter revenue, up 9% year-over-year and $30 million above guidance midpoint.
- U.S. Mortgage revenue grew 20%, Workforce Solutions revenue rose 9%, USIS revenue increased 12%, and International revenue was up 7% in Q4.
- Returned $561 million to shareholders in the quarter, including repurchasing 2.3 million shares for $500 million.
- Generated $1.13 billion in free cash flow for full-year 2025, a 40% increase from the prior year.
- Issued 2026 guidance for $6.72 billion in revenue (≈10.5% growth) and $8.50 adjusted EPS.
- Equifax introduced Income Confirm, a new product that integrates verified employment and income data from The Work Number with its consumer credit report.
- Income Confirm delivers applicants’ current job status and calculated annual income, enabling lenders to better assess risk and expedite approvals.
- The offering supports both decisioning and credit line assignment stages, helping lenders optimize initial credit lines based on true ability to pay.
- Provided data points include employee name/SSN, employer name, employment status, and annualized income.
- Equifax announced the launch of Synthetic Identity Risk, an AI-driven fraud detection product designed to identify and prevent synthetic identity fraud, one of the fastest-growing identity threats in lending.
- The solution leverages machine learning algorithms to analyze identity data, credit history, and behavioral signals for real-time risk assessment at account opening or continuous portfolio monitoring.
- By shifting lenders from reactive loss recovery to proactive prevention, the product aims to reduce financial losses and enhance trust with legitimate customers.
- Equifax data indicates the average cost per charged-off synthetic identity is $13,000, highlighting the significant financial impact of undetected synthetic fraud.
- Equifax secured 27 new patents in the second half of 2025, bringing its total for the year to 62, with 20 patents supporting its AI-driven EFX.AI strategy.
- The company holds nearly 700 issued or pending patents across 15 countries, including 320+ focused on responsible AI techniques.
- Recent patents cover innovations such as production-ready attribute management in Equifax Ignite, expedited risk data validation, and machine-learning–based integrated risk scoring.
- Backed by an approximately $3 billion multi-year investment in its Equifax Cloud infrastructure, these patents aim to accelerate AI-enabled product development and consumer decisioning.
Quarterly earnings call transcripts for EQUIFAX.
Ask Fintool AI Agent
Get instant answers from SEC filings, earnings calls & more