Earnings summaries and quarterly performance for General Motors.
Executive leadership at General Motors.
Mary Barra
Chief Executive Officer
Grant Dixton
Executive Vice President, Chief Legal, Public Policy Officer and Corporate Secretary
Mark Reuss
President
Paul Jacobson
Executive Vice President and Chief Financial Officer
Rory Harvey
Executive Vice President and President, Global Markets
Board of directors at General Motors.
Al Kelly
Director
Devin Wenig
Director
Jami Miscik
Director
Jan Tighe
Director
Joanne Crevoiserat
Director
Jon McNeill
Director
Joseph Jimenez
Director
Mark Tatum
Director
Patricia Russo
Independent Lead Director
Wesley Bush
Director
Research analysts who have asked questions during General Motors earnings calls.
Dan Levy
Barclays PLC
8 questions for GM
Emmanuel Rosner
Wolfe Research
8 questions for GM
Ryan Brinkman
JPMorgan Chase & Co.
7 questions for GM
Adam Jonas
Morgan Stanley
6 questions for GM
Itay Michaeli
TD Cowen
6 questions for GM
Joseph Spak
UBS Group AG
6 questions for GM
Mark Delaney
The Goldman Sachs Group, Inc.
6 questions for GM
Chris McNally
Evercore ISI
4 questions for GM
Michael Ward
Citi Research
4 questions for GM
James Picariello
BNP Paribas
3 questions for GM
John Murphy
Bank of America
3 questions for GM
Andrew Percoco
Morgan Stanley
2 questions for GM
Colin Langan
Wells Fargo & Company
2 questions for GM
Daniel Roeska
Bernstein Research
2 questions for GM
Federico Merendi
Bank of America
2 questions for GM
Joe Spak
UBS Group AG
2 questions for GM
Mike Ward
UBS
2 questions for GM
Tom Narayan
RBC Capital Markets
2 questions for GM
Edison Yu
Deutsche Bank
1 question for GM
Gautam Narayan
RBC Capital Markets
1 question for GM
Recent press releases and 8-K filings for GM.
- GM reduced inventory to 48 days, boosting free cash flow from ~$3 bn to $10 bn annually over the last 4–5 years.
- Despite $3 bn of tariff headwinds in 2025 and another $3–4 bn expected in 2026, North America margins returned to 8–10% about 12–18 months ahead of investor expectations.
- GM took $7 bn of charges in H2 2025 to right-size EV production capacity for ~8–12% adoption, leading to a more sustainable EV ramp.
- Announced $5 bn of U.S. onshoring investments by 2027, enabling domestic production of nearly 2 million vehicles to mitigate tariff impact.
- Developing its software-defined vehicle platform, targeting $7.5 bn of deferred revenue from Super Cruise, OnStar, and future digital services.
- GM absorbed >$3 billion in tariffs in 2025 and signals $3–4 billion in 2026, yet restored 8 %–10 % North America margins 12–18 months ahead of expectations.
- Took $7 billion of charges in H2 2025 on EV tooling for a 1 million VE/year capacity, realigning investments to match 8 %–12 % consumer EV adoption.
- Committed $5 billion of U.S. onshoring investments by 2027 to produce ~2 million vehicles and convert the Orion plant from EV to ICE to mitigate tariff exposure.
- Grew software and services with $7.5 billion of deferred revenue; Super Cruise and OnStar expansion will pave the way for hands-off autonomy by 2028.
- Expects a $1 billion–$2 billion regulatory tailwind in 2026 from EPA and CAFE rollbacks, while rolling out Gen 6 V8 engines—the most efficient V8s to date.
- GM delivered a strong 2025 with North America operating margins restored to 8%–10%—12–18 months ahead of investor expectations—despite absorbing $3 billion in tariffs and guiding for $3–4 billion in 2026.
- Inventory discipline reduced stock to 48 days (targeting 50–60 days), while annual free cash flow surged from $3 billion historically to about $10 billion, creating a buffer for future volatility.
- The company took $7 billion of EV-related charges in H2 2025 to right-size production capacity, aligning with a more measured EV adoption curve and driving cost reduction efforts in battery architecture.
- Announced $5 billion of onshoring investments by 2027, including retooling the Orion plant to ICE production, to mitigate long-term tariff impacts and support nearly 2 million U.S.-made vehicles annually.
- Emphasis on software and services growth: GM has built deferred revenue to $7.5 billion, expanding Super Cruise and paving the way for hands-off autonomy and a software-defined vehicle roadmap.
- Six DMD development projects are active, targeting 2027 volume production (SOP) in China and Europe on interior permanent-magnet synchronous motors, with plans to expand to external-rotor synchronous motors thereafter.
- In Q4 2025, a global tier-1 supplier completed DMD testing ahead of schedule; a Chinese OEM trial could enable remote wireless software upgrades by Q4 2026.
- In January 2026, a European OEM finished bench testing validating DMD’s real-world efficiency gains; two more OEMs are poised to begin trials by mid-2026.
- CEO John Fuller notes that software integration of DMD can deliver 0.5–1% energy-efficiency improvement on in-board permanent-magnet motors, with vehicle tests matching lab outcomes.
- Mitra EV secured $27 million in financing, comprising equity from Ultra Capital and a credit facility from S2G Investments to expand its capital-efficient fleet electrification platform.
- The funding will accelerate deployment of no-upfront-cost EV leasing (including GM, Ford, and Mercedes-Benz vehicles), dedicated overnight charging, and a shared DC fast-charging hub network aimed at serving 99% of U.S. fleet operators.
- The fully managed solution delivers immediate up to 75% operating cost reductions for commercial fleets by combining lower fueling costs and reduced maintenance.
- Proceeds will support expansion of shared charging infrastructure, additional fleet solutions, and entry into new markets.
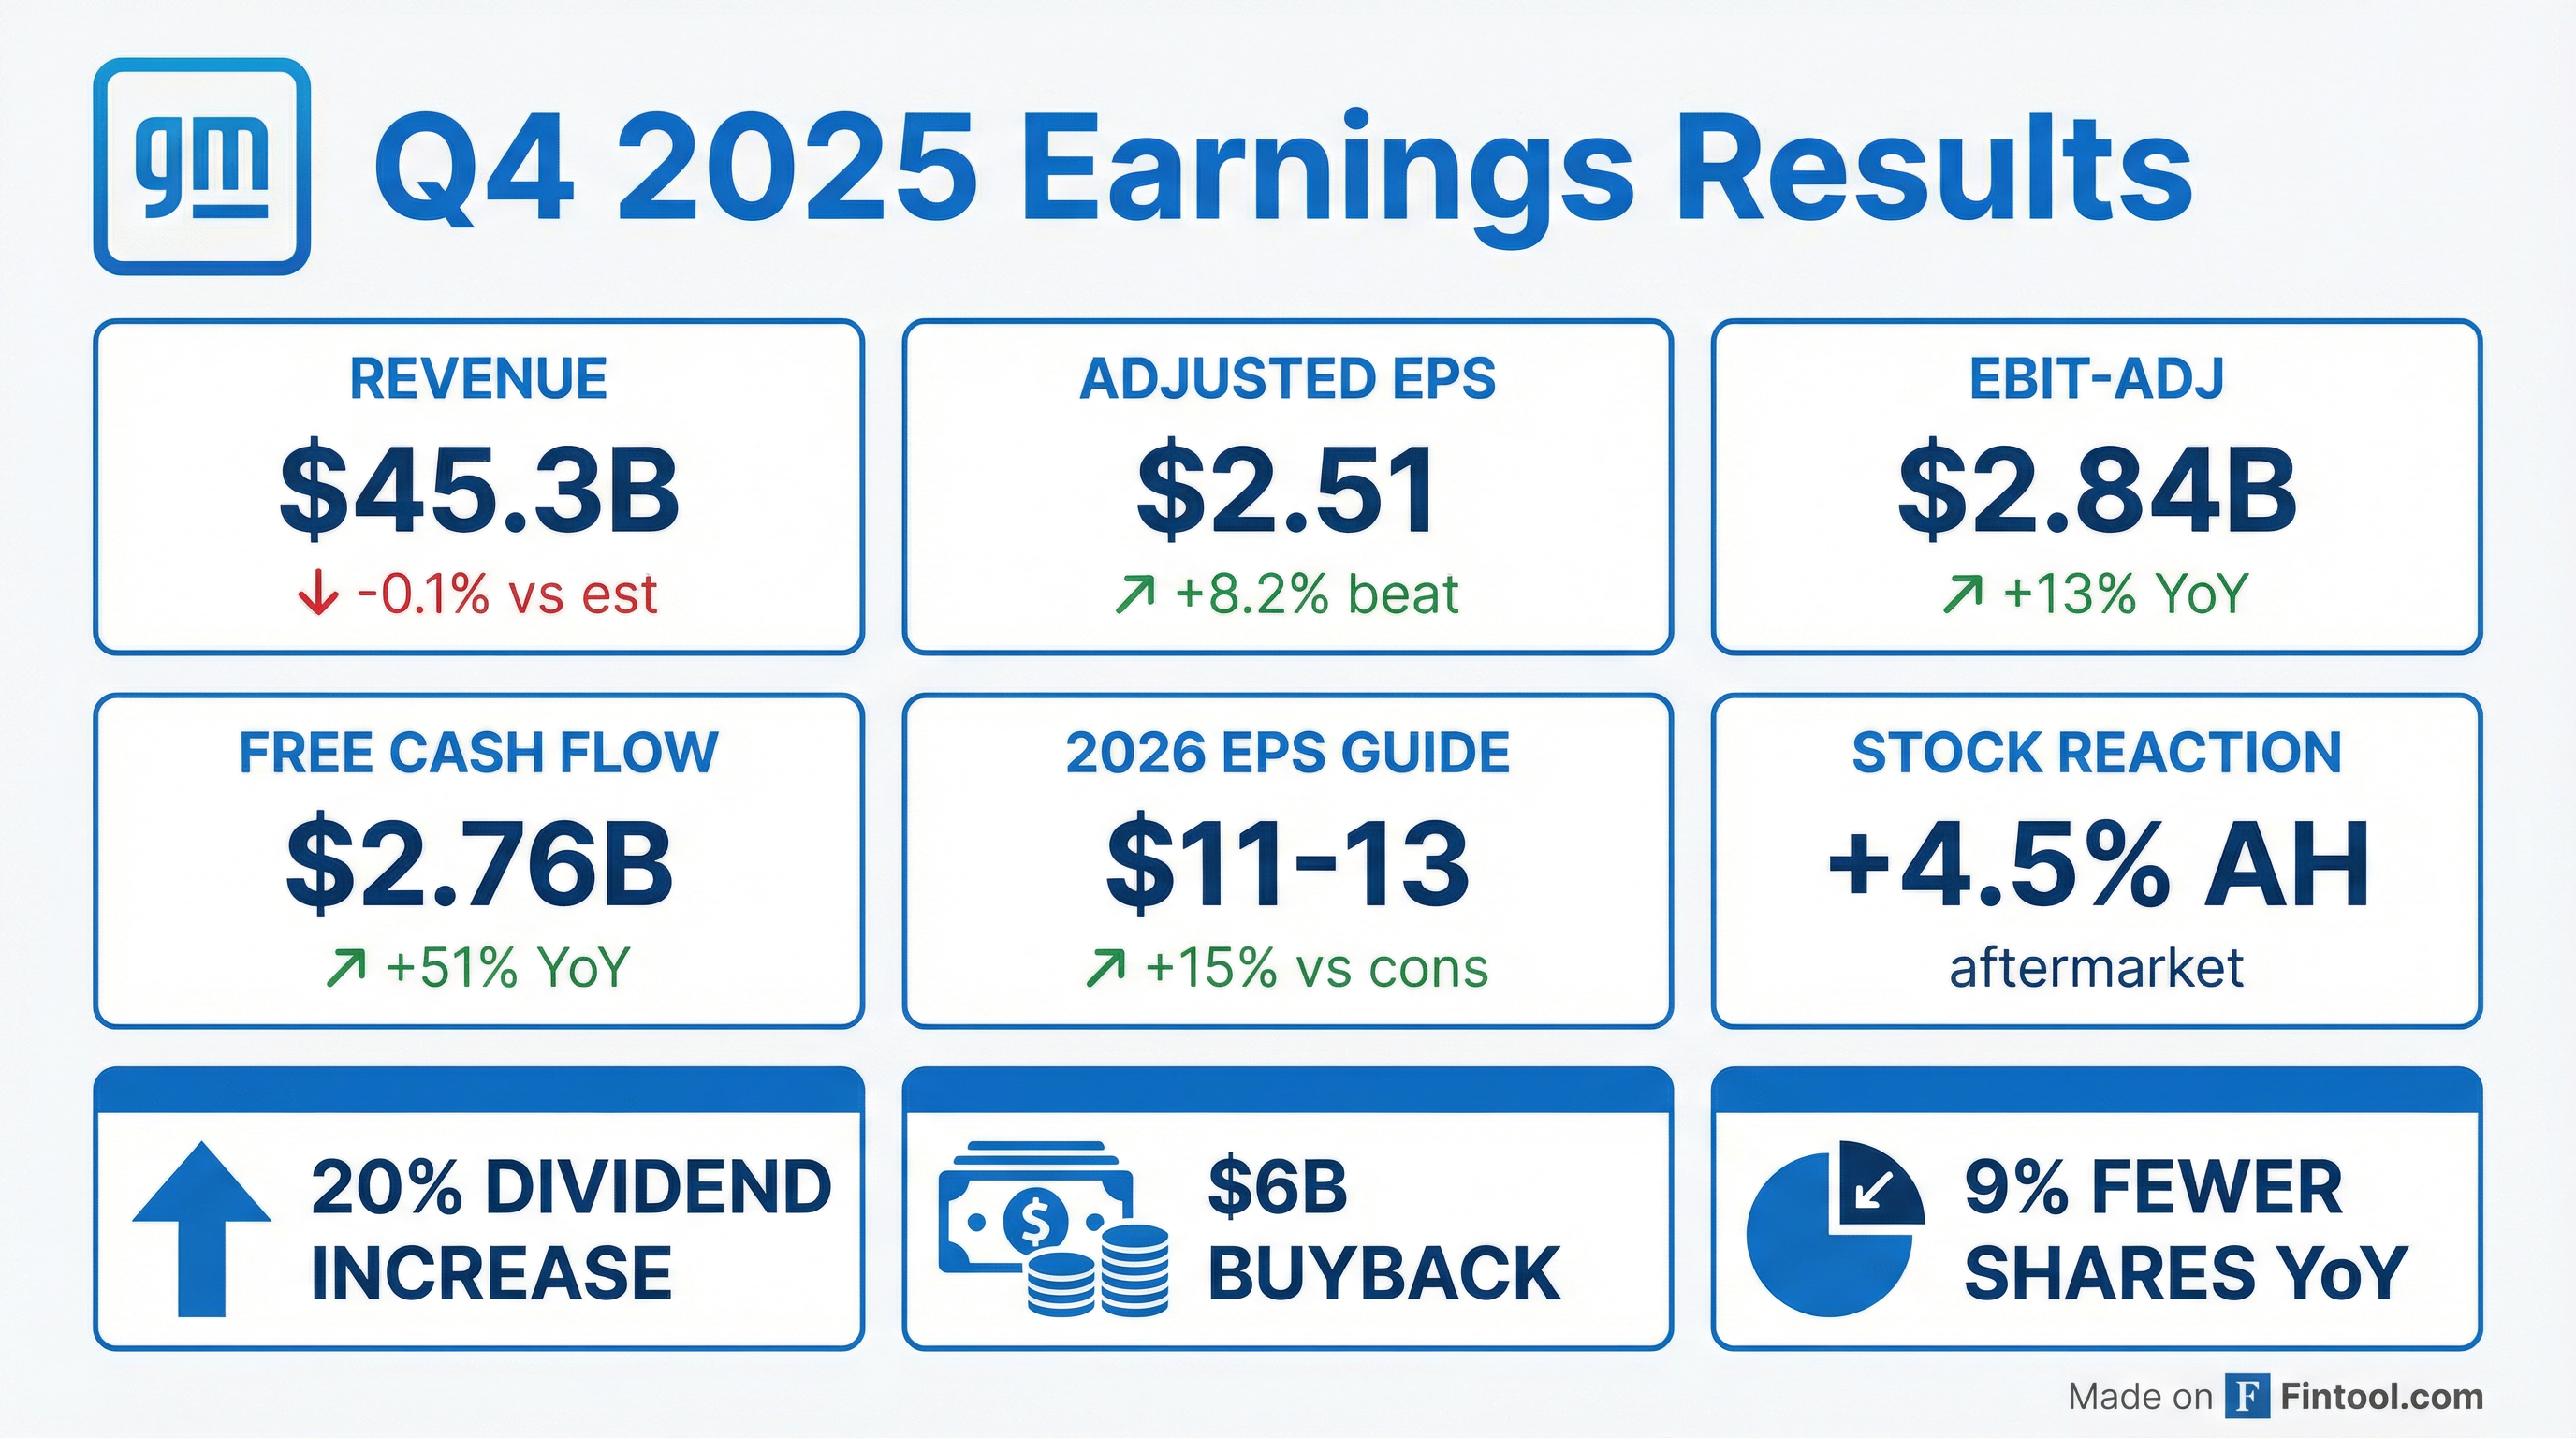
- GM delivered Q4 revenue of $45 B (–5% y/y), EBIT adj $2.8 B, EPS dil adj $2.51, and adj automotive FCF $2.8 B.
- Full-year 2025 results included EBIT adj $12.7 B, adj automotive FCF $10.6 B, year-end cash $21.7 B, 60 bps market share gain, and 54% total shareholder return.
- Capital returns: Q4 share repurchases of $2.5 B (33 M shares), $6 B total in 2025; board authorized an additional $6 B repurchase and raised the dividend 20% to $0.18.
- 2026 guidance: EBIT adj $13–15 B, EPS adj $11–13, adj automotive FCF $9–11 B, gross tariffs $3–4 B, targeting 8–10% North America margins.
- GM delivered $12.7 billion of adjusted EBIT and $10.6 billion of adjusted automotive free cash flow in 2025, ending with $21.7 billion in cash; the stock returned 54% to investors.
- GM achieved its highest U.S. market share in a decade in 2025, marking four consecutive years of share gains, and led the industry in full-size pickups and SUVs with award-winning models like the Cadillac Escalade IQ.
- GM recorded $7.6 billion of EV-related charges in Q3 and Q4 2025 to right-size its EV capacity—comprising impairments and contractual settlements—and expects significantly lower EV losses and cash outflows in 2026.
- For 2026, GM guides adjusted EBIT of $13–15 billion, adjusted EPS of $11–13 per share, and free cash flow of $9–11 billion, targets North America margins of 8–10%, and raised its quarterly dividend by 20%.
- Q4 revenue of $45 billion, adjusted EBIT of $2.8 billion, adjusted diluted EPS of $2.51, and adjusted automotive free cash flow of $2.8 billion.
- Full-year 2025 adjusted EBIT of $12.7 billion, adjusted automotive free cash flow of $10.6 billion, year-end cash balance of $21.7 billion, $6 billion in share repurchases, and $500 million in dividends; quarterly dividend raised 20% to $0.18 and new $6 billion buyback authorization approved.
- Full-year gross tariff costs of $3.1 billion (below prior guidance), with over 40% offset through pricing and cost actions; Q3–Q4 EV-related charges of $7.6 billion (of which $4.6 billion cash) as GM realigns EV capacity.
- 2026 guidance: adjusted EBIT of $13–15 billion, adjusted diluted EPS of $11–13, adjusted automotive free cash flow of $9–11 billion, and North America EBIT margin target of 8–10%; gross tariff costs expected at $3–4 billion.
- General Motors reported full-year 2025 net income of $2.7 billion and EBIT-adjusted of $12.7 billion, while fourth-quarter 2025 saw a $3.3 billion net loss and $2.8 billion in EBIT-adjusted.
- Q4 net income was reduced by over $7.2 billion of special charges related to EV capacity realignment and policy changes.
- For 2026, GM guides to $10.3 billion–$11.7 billion in net income, $13.0 billion–$15.0 billion in EBIT-adjusted, $19.0 billion–$23.0 billion in automotive operating cash flow, and $9.0 billion–$11.0 billion in adjusted automotive free cash flow.
- The Board raised the quarterly dividend by 20% to $0.18 per share, payable March 19, 2026, and authorized a new $6.0 billion share repurchase program.
- Q4 net loss of $3.3 billion driven by over $7.2 billion in special charges for EV capacity realignment and China restructuring ($7.914 B EV realignment; $842 M China exits).
- Beat Q4 adjusted EPS expectations, reporting $2.51 vs. $2.20 consensus.
- Automotive free cash flow nearly doubled to $2.8 billion; Q4 adjusted EBIT of $2.8 billion (North America $2.2 B; International $278 M).
- Dividend increased by 20% to $0.18 per share; authorized a $6.0 billion share repurchase program with no expiration.
Fintool News
In-depth analysis and coverage of General Motors.

GM CFO Says Automaker Returning to 8-10% Margins 'Ahead of Expectations' Despite $3B+ Tariff Hit

GM Takes $7.2 Billion EV Charge, Rewards Shareholders with $6 Billion Buyback

Trump Raises Tariffs on South Korea to 25%, Hammering Auto Stocks

FTC Slaps GM with 20-Year Consent Order After OnStar Data Scandal

GM Takes $7.6 Billion EV Hit—Detroit's Second Massive Retreat in a Month
Quarterly earnings call transcripts for General Motors.
Ask Fintool AI Agent
Get instant answers from SEC filings, earnings calls & more