Earnings summaries and quarterly performance for O REILLY AUTOMOTIVE.
Executive leadership at O REILLY AUTOMOTIVE.
Brad Beckham
Chief Executive Officer
Brent Kirby
President
David O'Reilly
Executive Vice Chairman of the Board
Greg Henslee
Executive Chairman of the Board
Jeremy Fletcher
Executive Vice President and Chief Financial Officer
Scott Ross
Executive Vice President and Chief Information Officer
Board of directors at O REILLY AUTOMOTIVE.
Research analysts who have asked questions during O REILLY AUTOMOTIVE earnings calls.
Michael Lasser
UBS
9 questions for ORLY
Scot Ciccarelli
Truist Securities
7 questions for ORLY
Gregory Melich
Evercore ISI
6 questions for ORLY
Simeon Gutman
Morgan Stanley
6 questions for ORLY
Steven Forbes
Guggenheim Securities, LLC
5 questions for ORLY
Steven Zaccone
Citigroup
5 questions for ORLY
Zachary Fadem
Wells Fargo
5 questions for ORLY
Bret Jordan
Jefferies
4 questions for ORLY
Christopher Horvers
JPMorgan Chase & Co.
4 questions for ORLY
Brian Nagel
Oppenheimer & Co. Inc.
2 questions for ORLY
Max Rakhlenko
TD Cowen
2 questions for ORLY
Christopher Bottiglieri
BNP Paribas
1 question for ORLY
David Bellinger
Mizuho Securities USA LLC
1 question for ORLY
Joshua Young
Truist
1 question for ORLY
Katharine McShane
Goldman Sachs Group, Inc.
1 question for ORLY
Michael Baker
D.A. Davidson & Co.
1 question for ORLY
Robert Ohmes
Bank of America
1 question for ORLY
Recent press releases and 8-K filings for ORLY.
- Comparable store sales in Q4 rose 5.6%, with full year comp up 4.7%, driving 6.4% sales growth to $17.8 billion in 2025.
- Operating profit was $3.5 billion (19.5% of sales), flat year-over-year; EPS reached $2.97, a 10% increase.
- 2025 CapEx totaled $1.2 billion; 2026 guidance set at $1.3–$1.4 billion, including 225–235 net new stores.
- 2026 outlook: comparable store sales 3–5%, revenue $18.7–$19 billion, EPS $3.10–$3.20, and operating margin 19.2–19.7%.
- Free cash flow was $1.6 billion in 2025, expected $1.8–$2.1 billion in 2026; repurchased 23 million shares for $2.1 billion.
- Comparable store sales rose 5.6% in Q4, bringing FY 2025 comps to 4.7%, and total sales increased 6.4% to $17.8 billion.
- Operating profit grew 6.4% to $3.5 billion (19.5% of sales) and EPS advanced to $0.71 in Q4 (+13%) and $2.97 for the year (+10%).
- For 2026, the company guides comparable store sales of 3%–5%, revenue of $18.7–19.0 billion, and EPS of $3.10–3.20.
- Capital expenditures are targeted at $1.3–1.4 billion in 2026 to fund 225–235 net new stores across the U.S., Mexico, and Canada (first Canadian Greenfield opened in Q4), plus distribution expansions including the Stafford, VA DC (opened) and Fort Worth, TX DC (operational Q1 2028).
- Record 2025 results with 33rd consecutive year of comparable store sales increases and Q4 comps up 5.6%, led by >10% growth in the professional segment and low single-digit DIY comps.
- 2026 comparable store sales guidance of 3%–5%, expecting stronger H1 comps due to same-SKU inflation timing, with professional ticket growth offsetting modest DIY traffic headwinds.
- Margin and profit targets: Q4 gross margin of 51.8% (+49 bps YoY); 2026 gross margin guidance 51.5%–52%; operating profit projected at 19.2%–19.7% of sales.
- CapEx and expansion plans: 2025 CapEx ~$1.2 B; 2026 CapEx guidance of $1.3–$1.4 B to support 225–235 net new store openings and distribution investments.
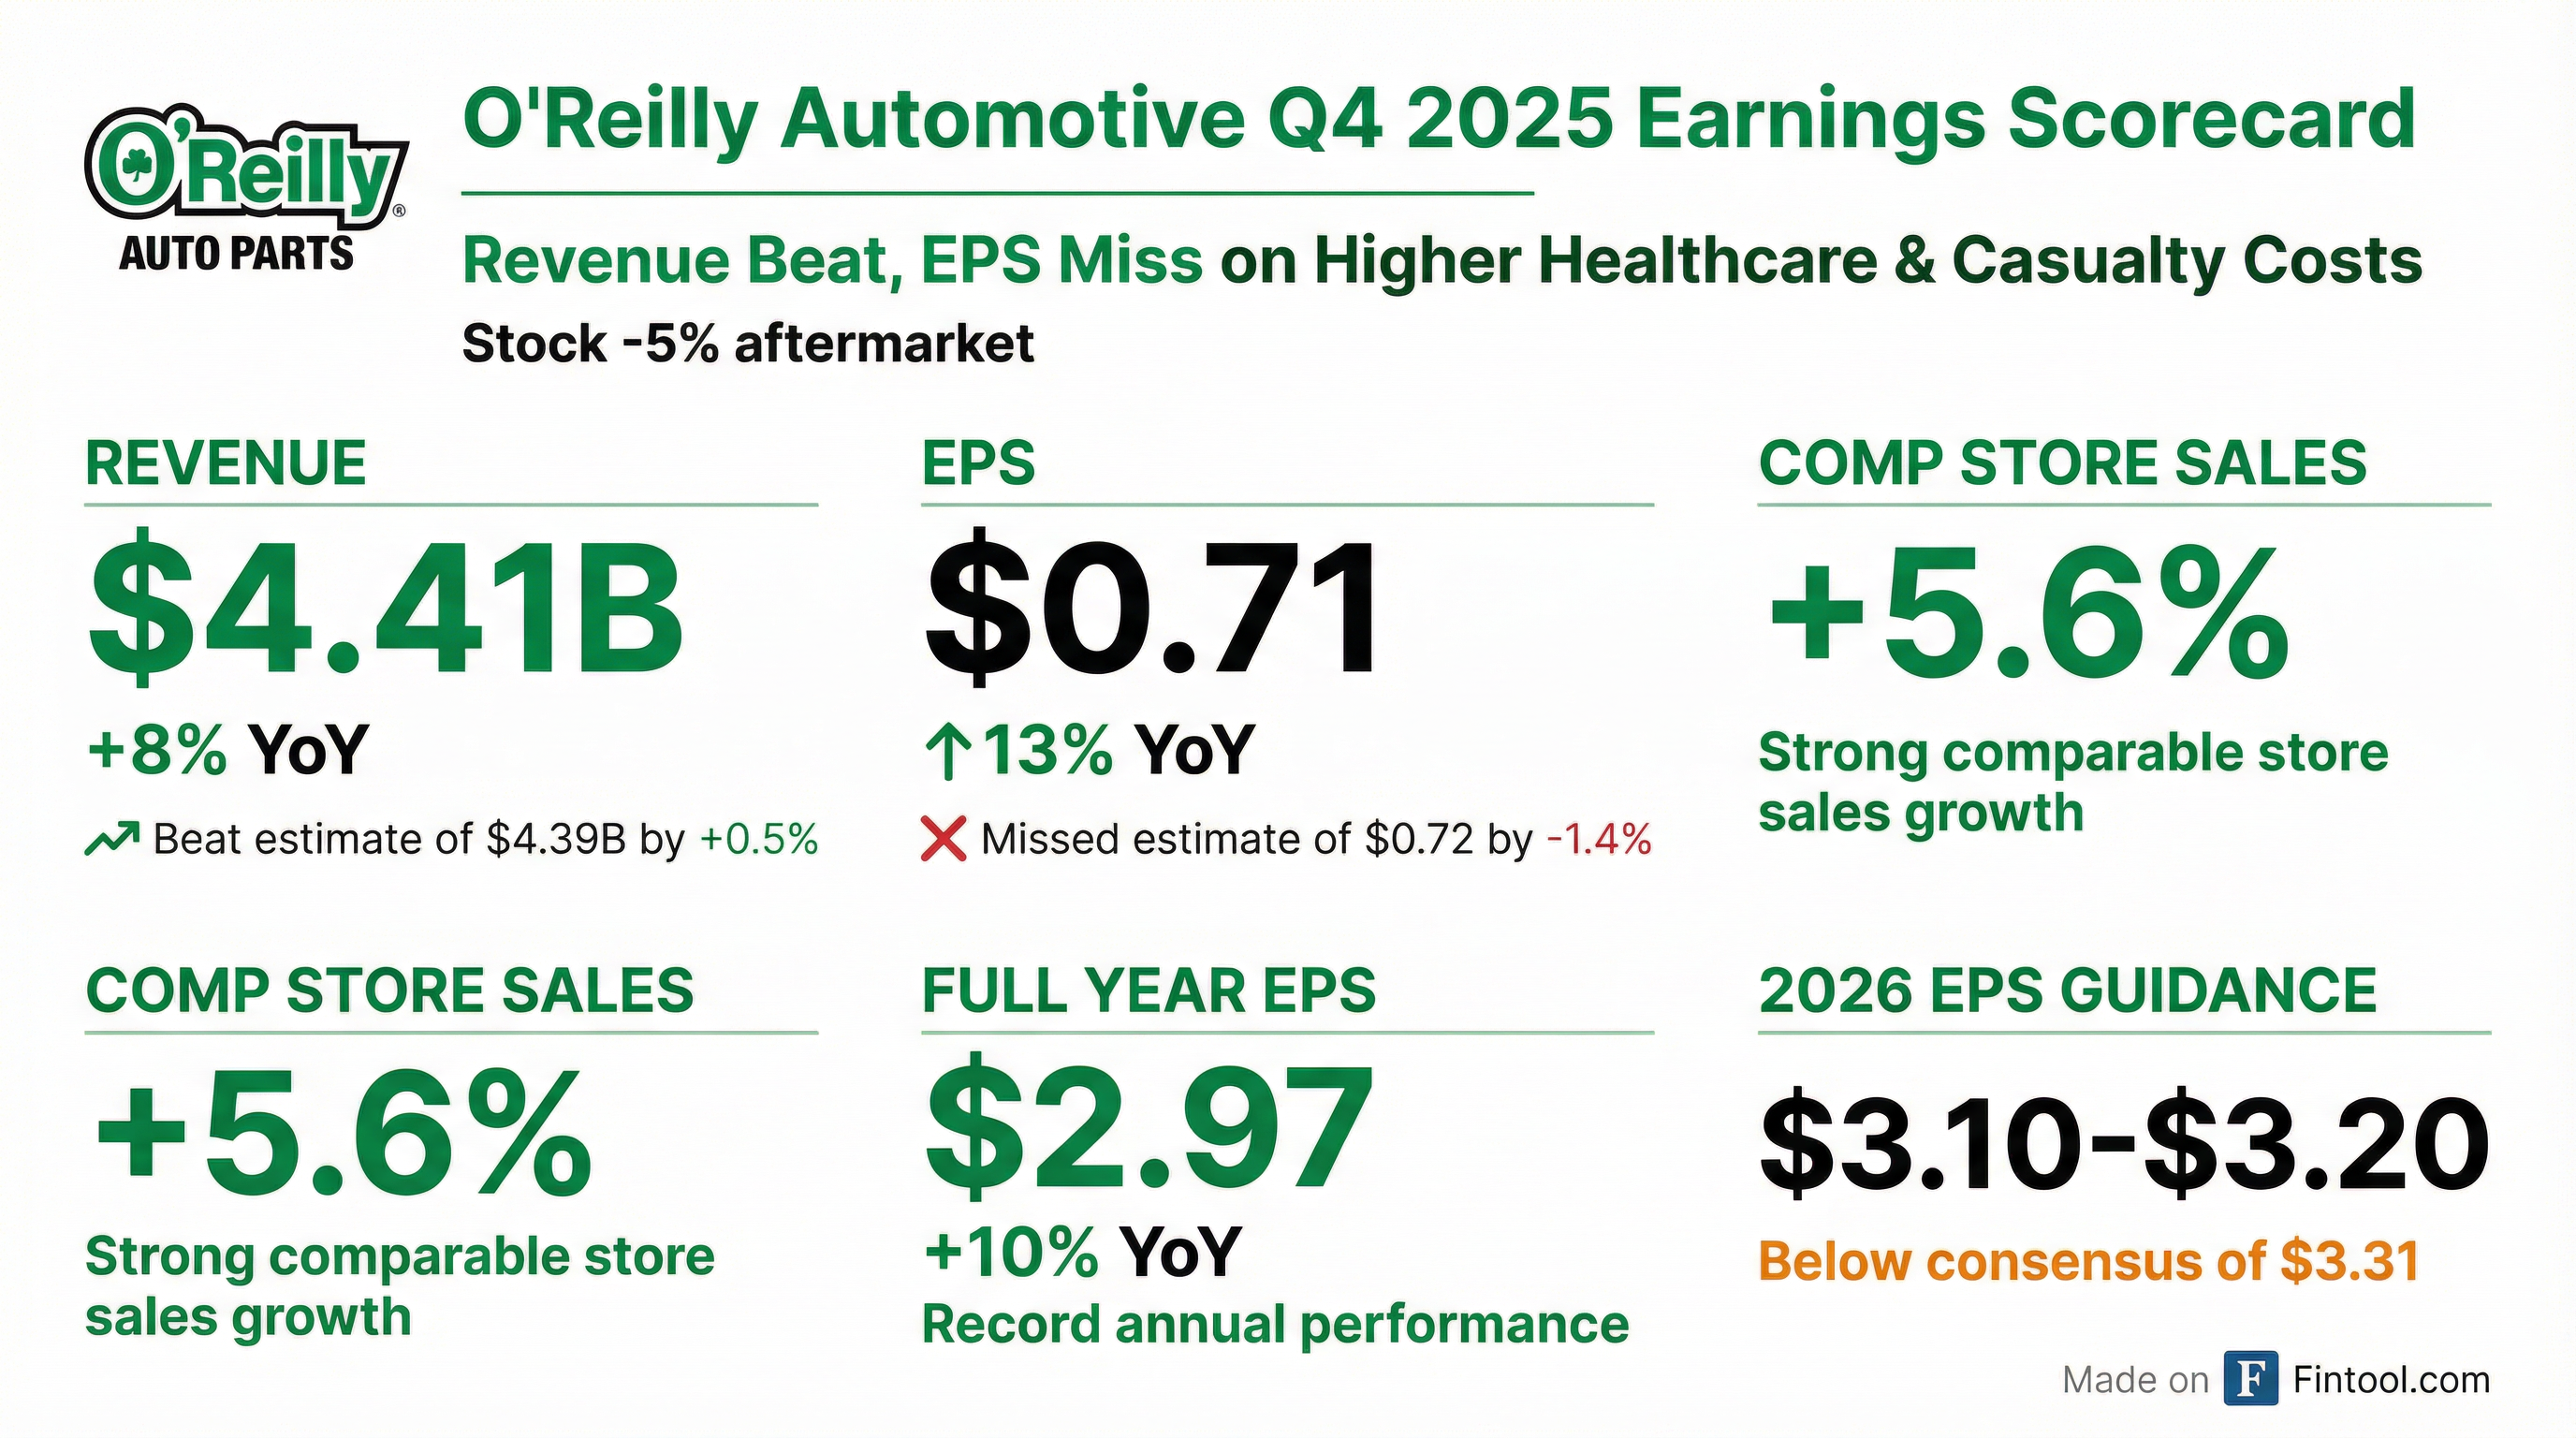
- Q4 comparable store sales rose 5.6%, and full-year comparable store sales rose 4.7%
- Q4 sales of $4.41 billion (+8% YoY) and diluted EPS of $0.71 (+13%); full-year sales of $17.78 billion (+6%) and diluted EPS of $2.97 (+10%)
- 2026 guidance of $18.7–19.0 billion in revenue and $3.10–3.20 in diluted EPS
- Repurchased 5.2 million shares in Q4 for $500 million, 22.7 million shares in 2025 for $2.10 billion, with $2.26 billion remaining under the buyback authorization
- In the last 18 months, O'Reilly expanded its dual market strategy into 100+ stores in Mexico and acquired Vast-Auto in Canada, highlighting continued North America growth opportunities.
- The company operates 31 regional distribution centers and over 300 hub stores, replenishing each retail location multiple times daily to guarantee time-definite parts availability.
- O'Reilly plans 200–210 new store openings in the current year and 225–235 next year, maintaining a disciplined ROI approach and focusing on assembling high-quality store teams.
- Management expects to have passed through the majority of tariff-driven cost increases, with pricing set dynamically in a rational market, and underscores the resilience of vehicle maintenance demand despite consumer pressures.
- O’Reilly operates a dual market strategy in retail and wholesale, serving roughly 10% of the North American addressable market and pursuing international growth with 100+ stores in Mexico and the Vast Auto acquisition in Canada.
- Its distribution network includes 31 regional DCs and 300+ hub stores, replenishing every location five nights a week and via multiple daytime runs within a 250-mile radius to ensure high parts availability.
- Organic growth is the primary use of capital, with plans to open 200–210 new stores in 2025 and 225–235 in 2026, supported by a new Mid-Atlantic distribution center and focus on assembling professional store teams for strong ROI.
- The company has passed through most tariff-driven cost increases, employs dynamic weekly pricing to maintain its value premium, and expects pricing to normalize by late 2026.
- Aftermarket demand remains resilient, with steady professional (DIFM) channel performance and only modest DIY big-ticket deferral observed, underpinned by the essential nature of vehicle maintenance.
- Revenue of $4.71 billion for Q3 2025, up about 7.8%–8% year-over-year, surpassing analyst expectations.
- GAAP EPS of $0.85–$0.86, beating consensus estimates.
- Raised full-year 2025 revenue guidance to $17.6 billion–$17.8 billion.
- Comparable store sales increased by 5.6%, while free cash flow margin declined to 6.3% from 11.5% a year ago.
- Balance sheet shows a current ratio of 0.72 and debt-to-equity of –6.75, with an interest coverage ratio of 14.6.
- Company delivered a 4.1% comparable store sales increase and $0.78 EPS in Q2, driven by strong professional business growth and DIY ticket size gains.
- Raised full-year comparable store sales guidance to 3.0%–4.5% (midpoint +75 bps) and updated EPS guidance to $2.85–$2.95 following a 15-for-1 stock split.
- Q2 gross margin was 51.4%, up 67 bps year-over-year; maintained full-year gross margin outlook of 51.2%–51.7% despite tariff-related cost pressures.
- Revised full-year SG&A per store growth to 3.0%–3.5%, with operating profit margin expected between 19.2%–19.7%.
- Opened 105 net new stores in H1 2025 and announced new distribution centers: a Haslet, TX DC (2027 start) and Stafford, VA DC (late 2025 start) to support future expansion.
- Board Elections and Change: At the Annual Meeting on May 15, 2025, shareholders elected new directors and accepted Larry O'Reilly’s resignation in line with the mandatory retirement policy.
- Stock Split and Increase in Authorized Shares: Shareholders approved amending the Articles of Incorporation to boost authorized common shares from 245M to 1.25B as part of a 15-for-1 stock split with a special stock dividend scheduled.
- EPS guidance increased to a range of $42.90–$43.40 with the announcement of a pending 15:1 stock split, reflecting strong Q1 performance and strategic cost management.
- Gross margins were reported at 51.3% in Q1 with full-year guidance maintained at 51.2%–51.7%, supported by a stable pricing environment and controlled tariff impacts.
- Sales performance drove Q1 revenue to $161 million, boosted by a 3.6% increase in comparable store sales and an additional $73 million from new stores, alongside free cash flow of $455 million.
- Capital and liquidity management were highlighted by the repurchase of 431,000 shares for $559 million and the extension of the revolving credit facility to $2.25 billion over an additional 5-year period.
Quarterly earnings call transcripts for O REILLY AUTOMOTIVE.
Ask Fintool AI Agent
Get instant answers from SEC filings, earnings calls & more