Earnings summaries and quarterly performance for BOEING.
Executive leadership at BOEING.
Kelly Ortberg
President and Chief Executive Officer
Brendan Nelson
Senior Vice President and President, Boeing Global
Brett Gerry
Chief Legal Officer and Executive Vice President, Global Compliance
Chris Raymond
President and CEO, Boeing Global Services
Dana Deasy
Chief Information Digital Officer and Senior Vice President, Information Technology & Data Analytics
Howard McKenzie
Chief Engineer and Executive Vice President, Engineering, Test & Technology
Jay Malave
Executive Vice President and Chief Financial Officer
Stephanie Pope
President and CEO, Boeing Commercial Airplanes
Stephen Biegun
Senior Vice President, Global Public Policy
Ted Colbert
President and CEO, Boeing Defense, Space & Security
Uma Amuluru
Executive Vice President and Chief Human Resources Officer
Board of directors at BOEING.
Akhil Johri
Director
David Gitlin
Director
David Joyce
Director
John Richardson
Director
Lynn Good
Director
Lynne Doughtie
Director
Robert Bradway
Director
Stayce Harris
Director
Steve Mollenkopf
Independent Board Chair
Tim Buckley
Director
Research analysts who have asked questions during BOEING earnings calls.
Noah Poponak
Goldman Sachs
8 questions for BA
Sheila Kahyaoglu
Jefferies
8 questions for BA
Peter Arment
Robert W. Baird & Co.
7 questions for BA
Seth Seifman
JPMorgan Chase & Co.
7 questions for BA
Ronald Epstein
Bank of America
6 questions for BA
Scott Deuschle
Deutsche Bank
6 questions for BA
Douglas Harned
Sanford C. Bernstein & Co., LLC
5 questions for BA
Myles Walton
Wolfe Research, LLC
5 questions for BA
Robert Stallard
Vertical Research Partners
5 questions for BA
David Strauss
Barclays
4 questions for BA
Jason Gursky
Citigroup Inc.
4 questions for BA
Doug Harned
Bernstein
3 questions for BA
Gavin Parsons
UBS Group AG
3 questions for BA
Kristine Liwag
Morgan Stanley
3 questions for BA
Scott Mikus
Melius Research
3 questions for BA
Gautam Khanna
TD Cowen
2 questions for BA
Myles Alexander Walton
Wolfe Research
2 questions for BA
Richard Safran
Seaport Research Partners
2 questions for BA
Cai von Rumohr
TD Cowen
1 question for BA
Kenneth Herbert
RBC Capital Markets
1 question for BA
Miles Walton
Wolfe Research
1 question for BA
Peter J. Arment
Baird
1 question for BA
Ron Epstein
Bank of America Corporation
1 question for BA
Seth Michael Seifman
JPMorgan Chase & Co.
1 question for BA
Recent press releases and 8-K filings for BA.
- Aeroméxico transported 2.053 million passengers in January, a 1.8% year-over-year decline, driven by a 4.2% drop in domestic traffic and a 2.7% rise in international traffic.
- Total capacity (ASMs) fell 2.3% year-over-year, with domestic ASMs down 3.6% and international ASMs down 1.7%.
- Demand (RPMs) grew 1.1%, as international RPMs rose 3.8% despite a 5.0% decrease in domestic RPMs.
- Load factor improved by 2.9 percentage points to 87.0%, led by a 4.7 p.p. increase for international routes.
- CEO Andrés Conesa said capacity is expected to resume growth in Q2 2026, underscoring a focus on sustainable, disciplined network management.
- Boeing and Air Cambodia finalized a firm order of 10 737-8 jets with options for 10 more, marking the airline’s largest single-aisle purchase and first Boeing aircraft acquisition.
- The 737-8 seats up to 178 passengers over a range of 3,500 nm and delivers 20% lower fuel use and emissions than the aircraft it replaces, aiding Air Cambodia’s regional growth.
- Announced at the Singapore Airshow, the deal enables Air Cambodia to launch direct services across North and Southeast Asia while modernizing and expanding its fleet of six single-aisle and regional jets.
- Boeing projects Southeast Asian carriers will need nearly 5,000 new airplanes over the next 20 years, with single-aisle jets comprising more than 80% of deliveries.
- Air India ordered 30 additional Boeing 737 MAX aircraft (20 737-8 and 10 737-10), expanding its Boeing order book to nearly 200 airplanes across single-aisle and widebody families.
- The airline exercised existing options for 20 737-8s this month and disclosed a previously unidentified order for 10 737-10s on Boeing’s Orders & Deliveries website.
- New deliveries will bolster Air India’s domestic and regional network with fuel-efficient, high-reliability single-aisle jets.
- Boeing forecasts the Indian and South Asian region will need nearly 3,300 new airplanes over the next two decades, with 90% being single-aisle jets like the 737 MAX.
- At Wings India 2026, Air India exercised options for 30 Boeing 737 MAX narrowbodies (20 737-8s, 10 737-10s) and converted 15 A321neo orders to A321XLRs, bringing its total Boeing commitments to 250 aircraft.
- Boeing’s backlog for Air India now shows 198 Boeing jets remaining to be delivered: 169 737 MAXs, 19 787s, and 10 777s.
- Air India has roughly 600 firm aircraft commitments across Airbus and Boeing after the latest additions and conversions.
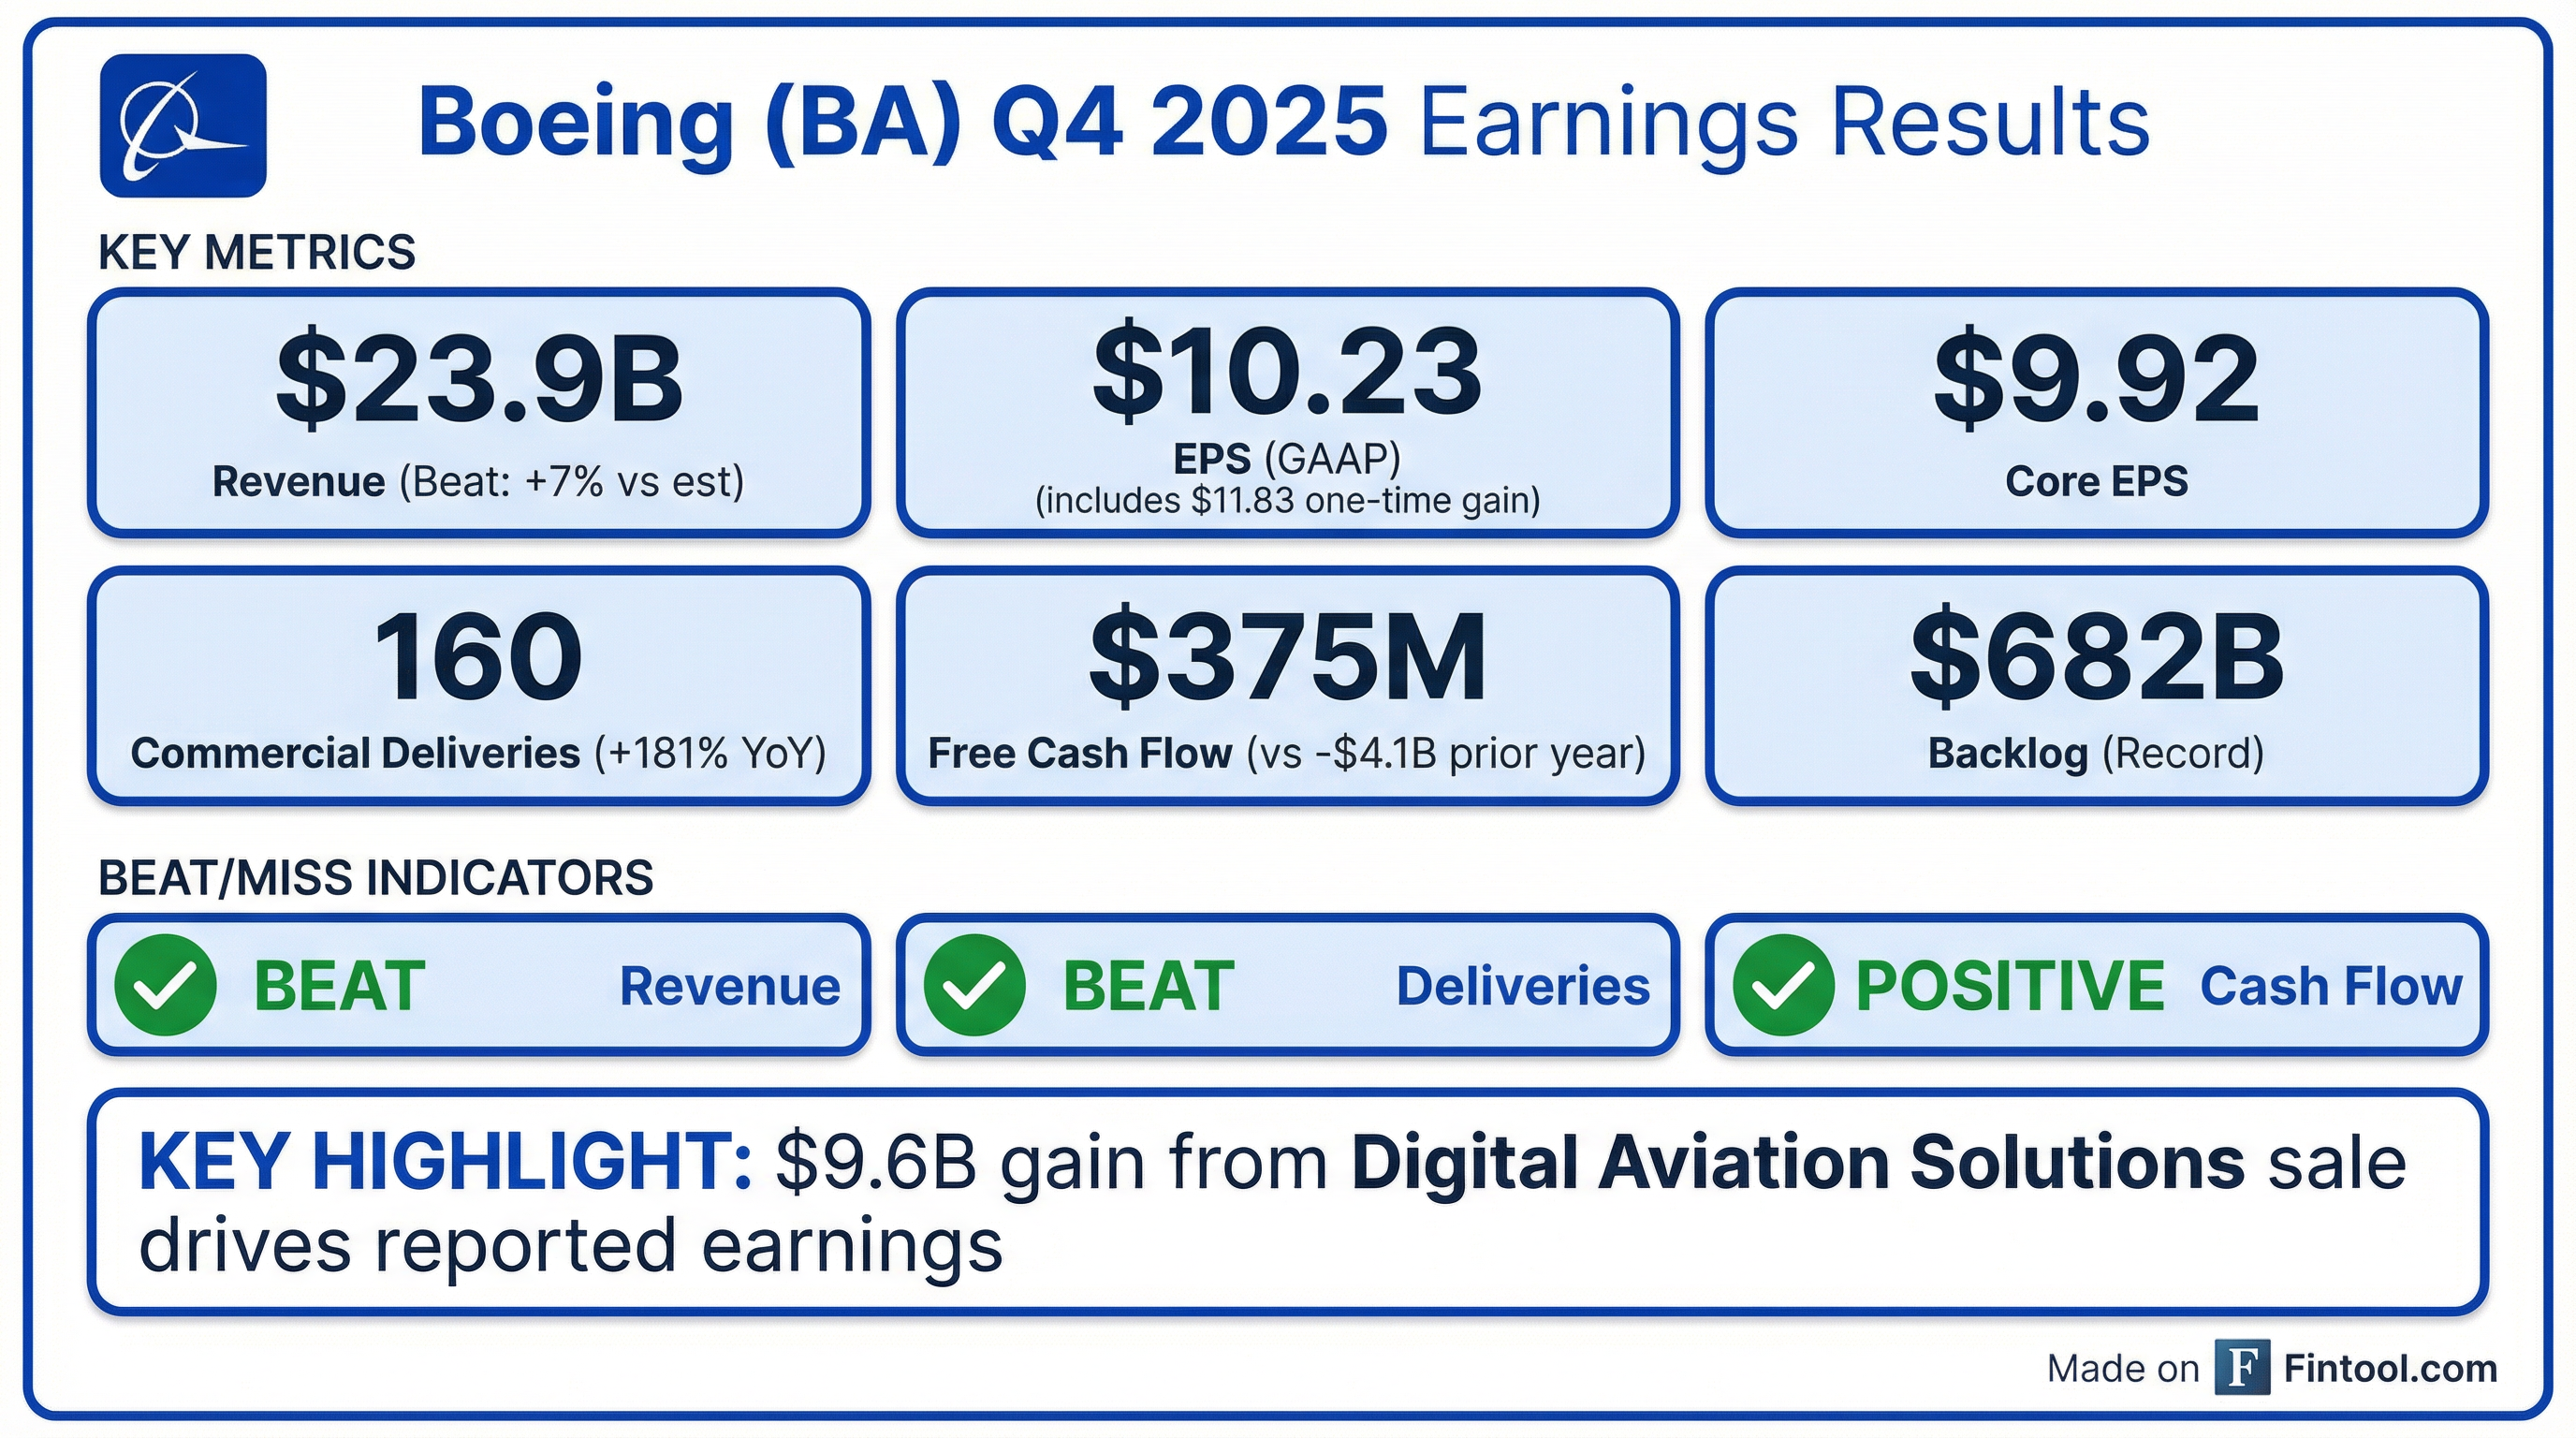
- Boeing reported Q4 EPS of $9.92 and sales of $23.9 billion, exceeding expectations despite a subsequent 1.6% and 1.2% stock decline on consecutive days.
- Q4 revenue of $23.9 B, up 57% year-over-year, with core EPS of $9.92 reflecting an $11.83 B gain on the Jeppesen divestiture; free cash flow of $375 M in the quarter.
- Commercial Airplanes delivered 160 jets in Q4 (600 in 2025, highest since 2018); Q4 revenue $11.4 B with –5.6% operating margin, backlog reached $567 B (6,100+ aircraft).
- Defense and Services: BDS delivered 37 aircraft (Q4 revenue $7.4 B, margin –6.8% including a $565 M KC-46A loss; backlog $85 B, orders $15 B) and BGS posted $5.2 B revenue (adjusted margin 18.6%), with $10 B in Q4 orders and $30 B backlog.
- Completed the Spirit AeroSystems acquisition and $10.6 B Jeppesen sale; guiding 2026 free cash flow of $1–3 B with capex around $4 B to support production rate increases.
- Boeing’s Q4 2025 revenue was $23.9 B, up from $15.2 B in Q4 2024.
- Q4 operating margin improved to 36.7%, versus (24.7)% a year earlier.
- Core EPS turned positive at $9.92, compared to a loss of ($5.90) in Q4 2024.
- Free cash flow was $0.4 B, versus negative ($4.1 B) in the prior-year quarter.
- Q4 revenue of $23.9 B, up 57% year-over-year, with core EPS of $9.92 (including an $11.83 B gain on the Digital Aviation Solutions divestiture) and positive free cash flow of $375 M.
- Full-year 2025 revenue of $89.5 B, up 34%, core EPS of $1.19 (ex-gain EPS up $9.10), free cash flow usage of $1.9 B, and 2026 free cash flow guidance of $1–3 B (normalized target of $10 B).
- BCA delivered 160 aircraft in Q4 (600 in FY), achieved a record backlog of $567 B, and raised production to 42/mo (targeting 47/mo later in 2026); the Spirit AeroSystems acquisition weighed on Q4 margins by ~1.5 pts.
- BGS Q4 revenue of $5.2 B (adjusted +6%), adjusted operating margin of 18.6%, orders of $10 B in Q4 ($28 B FY), and backlog of $30 B.
- 600 commercial airplanes delivered and over 1,100 orders in 2025; 737 production stabilized at 42/mo and 787 at rate 8, with plans to exceed 47/mo on 737 and reach 10/mo on 787 later in 2026.
- FY 2025 revenue of $89.5 billion (+34%) and Core EPS of $1.19 (including a $12.47 digital aviation solutions gain); 2025 free cash flow usage of $1.9 billion, with 2026 FCF guidance of $1–3 billion.
- Closed the $10.6 billion Jeppesen sale and completed Spirit AeroSystems acquisition to streamline operations and bolster services capabilities.
- Advanced certification programs: 737-10 secured TIA 2 and both 737 variants expected certified in 2026; 777-9 gained TIA 3 and remains on track for first delivery in 2027 despite an engine durability issue.
- Boeing reported adjusted core EPS of $9.92, net income of $8.13 billion, and revenue of $23.95 billion, driven by a $9.6 billion gain from the sale of part of its Digital Aviation Solutions unit.
- On a non-GAAP basis, Boeing posted a loss per share of ($1.91) versus a ($0.40) expected; commercial revenue jumped 139% to $11.38 billion with deliveries up 181% to 160 aircraft, while defense, space & security revenue rose 37.1% to $7.42 billion.
- Trailing-12-month revenue reached $80.76 billion, with an operating margin of –10.43%, net margin of –12.2%, and a market capitalization of about $194.54 billion.
- Shares slipped about 2.3% in premarket trading as investors weighed the sustainability of the operational recovery beyond the one-time asset-sale benefit.
- Acquired Spirit AeroSystems in December 2025, underscoring production stability efforts.
- Revenue rose 57% year-over-year to $23.9 Billion, with GAAP EPS of $10.23, bolstered by a $9.6 Billion gain on the Digital Aviation Solutions sale.
- Operating cash flow was $1.3 Billion, and non-GAAP free cash flow reached $0.4 Billion in the quarter.
- Full-year backlog expanded to a record $682 Billion, including over 6,100 commercial airplanes.
Fintool News
In-depth analysis and coverage of BOEING.

Boeing Posts First Profit Since 2023, But Core Unit Losses Expose Recovery's Fragility

Boeing Knew About Engine Mount Flaw 15 Years Before Fatal UPS Crash, NTSB Reveals

Boeing Delivers 600 Jets in 2025—Its Best Year in Seven as Turnaround Takes Flight

Boeing Lands $8.6 Billion F-15 Contract for Israel as Defense Unit Recovery Gains Momentum

Tory Bruno Joins Blue Origin to Lead National Security Push

China Sanctions 20 US Defense Firms Over Record $11.1B Taiwan Arms Deal
Quarterly earnings call transcripts for BOEING.
Ask Fintool AI Agent
Get instant answers from SEC filings, earnings calls & more