Earnings summaries and quarterly performance for COCA COLA.
Executive leadership at COCA COLA.
James Quincey
Chief Executive Officer
Henrique Braun
Executive Vice President and Chief Operating Officer
Jennifer Mann
Executive Vice President and President, North America operating unit
John Murphy
President and Chief Financial Officer
Manuel Arroyo
Executive Vice President and Global Chief Marketing Officer
Monica Howard Douglas
Executive Vice President and Global General Counsel
Board of directors at COCA COLA.
Amity Millhiser
Director
Ana Botín
Director
Bela Bajaria
Director
Caroline Tsay
Director
Carolyn Everson
Director
Christopher Davis
Director
David Weinberg
Lead Independent Director
Herb Allen
Director
Maria Elena Lagomasino
Director
Max Levchin
Director
Thomas Gayner
Director
Research analysts who have asked questions during COCA COLA earnings calls.
Andrea Teixeira
JPMorgan Chase & Co.
6 questions for KO
Dara Mohsenian
Morgan Stanley
6 questions for KO
Filippo Falorni
Citigroup Inc.
6 questions for KO
Kaumil Gajrawala
Jefferies
6 questions for KO
Lauren Lieberman
Barclays
6 questions for KO
Charlie Higgs
Redburn Atlantic
5 questions for KO
Peter Grom
UBS Group
5 questions for KO
Bonnie Herzog
Goldman Sachs
4 questions for KO
Carlos Laboy
HSBC
4 questions for KO
Christopher Carey
Wells Fargo & Company
4 questions for KO
Robert Moskow
TD Cowen
4 questions for KO
Robert Ottenstein
Evercore ISI
4 questions for KO
Bryan Spillane
Bank of America
3 questions for KO
Michael Lavery
Piper Sandler & Co.
3 questions for KO
Peter Galbo
Bank of America
3 questions for KO
Stephen Robert Powers
Deutsche Bank
3 questions for KO
William Chappell
Truist Securities
3 questions for KO
Chris Carey
Wells Fargo Securities
2 questions for KO
Kevin Grundy
BNP Paribas
2 questions for KO
Rob Ottenstein
Evercore
2 questions for KO
Stephen Powers
Deutsche Bank
2 questions for KO
Nik Modi
RBC Capital Markets
1 question for KO
Steve Powers
Deutsche Bank
1 question for KO
Recent press releases and 8-K filings for KO.
- Coca-Cola reaffirms its network operating model guided by the “four I’s” (insight, innovation, intimacy, integration) to marry global scale with local data-driven precision and break down silos across the system.
- The company is deepening intimacy with consumers by delivering core content tailored at scale—exemplified by its World Cup anthem and campaign adaptations in diverse markets like Haiti and Germany.
- Digital transformation remains a priority: Coca-Cola has migrated to the cloud, integrated its core applications and datasets, and is investing in AI and other technologies to accelerate top-line growth in partnership with its new Chief Digital Officer.
- In North America, a strong consumer base supports balanced growth in volume, price and mix, with fairlife’s 30 % capacity expansion driving innovation; globally, Coca-Cola is adapting its playbook to regional challenges in EMEA, Latin America and resetting strategy in China and India for long-term growth.
- The company expects continued margin expansion via supply-chain productivity and refranchising benefits (with 2026 gains weighted to the back half) and is preserving capital allocation optionality amid its IRS tax case while maintaining investment in the business and dividend support.
- CFO John Murphy reaffirmed the company’s consumer-centric framework built on the “four I’s”: insight, innovation, intimacy, and integration to drive local precision at global scale.
- Coca-Cola is upgrading its digital foundations—migrating to cloud-based applications and integrating data sets—to leverage AI and accelerate speed-to-market and personalized consumer engagement.
- North America remains a key growth engine, with a strong consumer base, volume focus around events like the FIFA World Cup, and 30% additional fairlife capacity online to sustain share gains.
- In EMEA, the Middle East business prioritizes employee safety and operational resilience amid geopolitical risks, while Europe faces cautious consumers but continues market share gains through targeted local execution.
- Maintain capital‐allocation optionality pending the IRS tax case outcome, prioritizing business investment and dividend support; margin expansion will be driven by ongoing supply‐chain efficiencies and refranchising benefits, with 2026 operating margin gains expected to be back-half weighted.
- Emphasized the “four I’s” framework—insight, innovation, intimacy, integration—to enhance consumer centricity by unifying global data and leveraging local activation.
- Digital transformation advances include full cloud migration and end-to-end application integration, prioritizing tech-driven top-line growth across consumer engagement, bottler collaboration, and enterprise operations.
- Regional outlook: North America driving volume through consumer de-averaging and expanded fairlife capacity; EMEA balancing cautious European spending with Middle East safety measures; Latin America offsetting Mexico’s sugar tax via pricing and World Cup activations; Asia-Pacific refocusing China portfolio and capitalizing on India’s infrastructure build-out.
- Margin expansion remains a long-term priority via supply-chain efficiencies and refranchising levers, with 2026 operating margin gains expected to be back-half weighted, while maintaining capital allocation optionality amid the IRS tax case to support dividends and strategic investments.
- Q4 net sales rose 17.6% to $2.13 billion; operating income increased 42.3% to $542.6 million.
- Q4 net income grew 65.9% to $449.2 million; diluted EPS rose 64.9% to $0.46.
- FY2025 net sales increased 10.7% to $8.29 billion; net income rose 26.3% to $1.91 billion; diluted EPS was $1.94.
- Effective Feb. 25, 2026, Rob Gehring was named CEO, Americas; Guy Carling CEO, EMEA & OSP; and Emelie Tirre Chief Strategy Officer.
- FEMSA consolidated Q4 revenues grew 5.7% and income from operations increased 8.5% year-on-year.
- Proximity Americas unit saw Q4 revenues up 5.3% and operating income climb 7.7% versus 4Q24.
- Spin by OXXO active users reached 10.5 million (+22.0%) and Spin Premia loyalty users hit 28.1 million (+13.8%), with OXXO Mexico tender at 49.3% (vs. 40.7% in 4Q24).
- Coca-Cola FEMSA delivered Q4 revenue growth of 2.9% and a 13.3% rise in operating income year-over-year.
- 2026 guidance targets 4–5% organic revenue growth, 7–8% comparable EPS growth, and ~$12.2 B free cash flow (Non-GAAP).
- Since 2017, Coca-Cola has delivered 7% average organic revenue growth vs. 4% for CPG peers, generated 2.1× cash flow vs. 1.1× peers, expanded comparable operating margin by +5 pts vs. –3 pts peers, and achieved 23% ROIC vs. 12% peers in 2025.
- Free cash flow has risen from $9.7 B in 2023 to $11.4 B in 2025 (ex-fairlife payment) with a 2026 outlook of ~$12.2 B.
- The long-term growth algorithm targets 4–6% organic revenue growth, 6–8% operating income growth, 7–9% EPS growth, and 90–95% adjusted FCF conversion.
- Henrique Braun, CEO-elect, highlighted three enduring strengths—industry opportunity, 32 billion-dollar brands, and a unique bottler system—and three guiding principles for the next chapter: consumer-centricity, local “Must Win Missions,” and digital integration.
- The company has pruned its brand portfolio from 400+ to fewer than 170 brands, improved innovation success rates, and will accelerate insight-driven, locally sourced ideas with global scale potential.
- CFO John Murphy reaffirmed 2026 targets: organic revenue growth within the long-term algorithm, high single-digit EPS growth, continued brand and market investments, and sustained free cash flow generation.
- The operating model remains focused on top-line growth; margin expansion via cross-enterprise procurement and modern marketing; cash flow; balance-sheet optimization through refranchising; and a new “Fuel Life 360” tool to optimize end-to-end spending with bottler partners.
- Coca-Cola introduced Henrique Braun as COO and CEO-elect, succeeding James Quincey, and highlighted three enduring strengths: vast industry opportunity, the ability to build and grow billion-dollar brands, and an unmatched bottler system for global scale.
- The company will pursue three new growth principles—enhanced consumer-centricity via the “4 I’s” (Insights, Innovation, Intimacy, Integration), agile local-to-global “Must Win Missions” for rapid innovation, and embedding digital in every connection—to accelerate its next chapter.
- CFO John Murphy reaffirmed 2026 targets: organic revenue growth in line with its long-term algorithm and high single-digit EPS growth, bolstered by currency tailwinds, continued brand and market investments, and strong free cash flow.
- Strategic financial priorities include further margin expansion through gross-margin discipline, more efficient modern marketing, an optimized asset-light model, and a new “Fuel Life 360” platform for end-to-end resource allocation and spend effectiveness.
- Highlighted three enduring strengths: belief in the beverage industry’s long-term opportunity, growth of billion-dollar brands from 30 to 32, and an unparalleled bottling system driving a multiplying effect with aligned partners.
- Introduced three new principles to accelerate growth: enhanced consumer-centricity via the “4 Is” (insights, innovation, intimacy, integration), embedding digital in every system connection, and a constructive discontent mindset to continually improve.
- Launched a “Must Win Missions” framework to align local market development stages with brand priorities and tailored incentives, aiming to scale new billion-dollar brands more rapidly.
- CFO reaffirmed 2026 financial targets: organic revenue growth within the long-term algorithm and high single-digit EPS growth, aided by currency tailwinds and robust underlying cash flow generation.
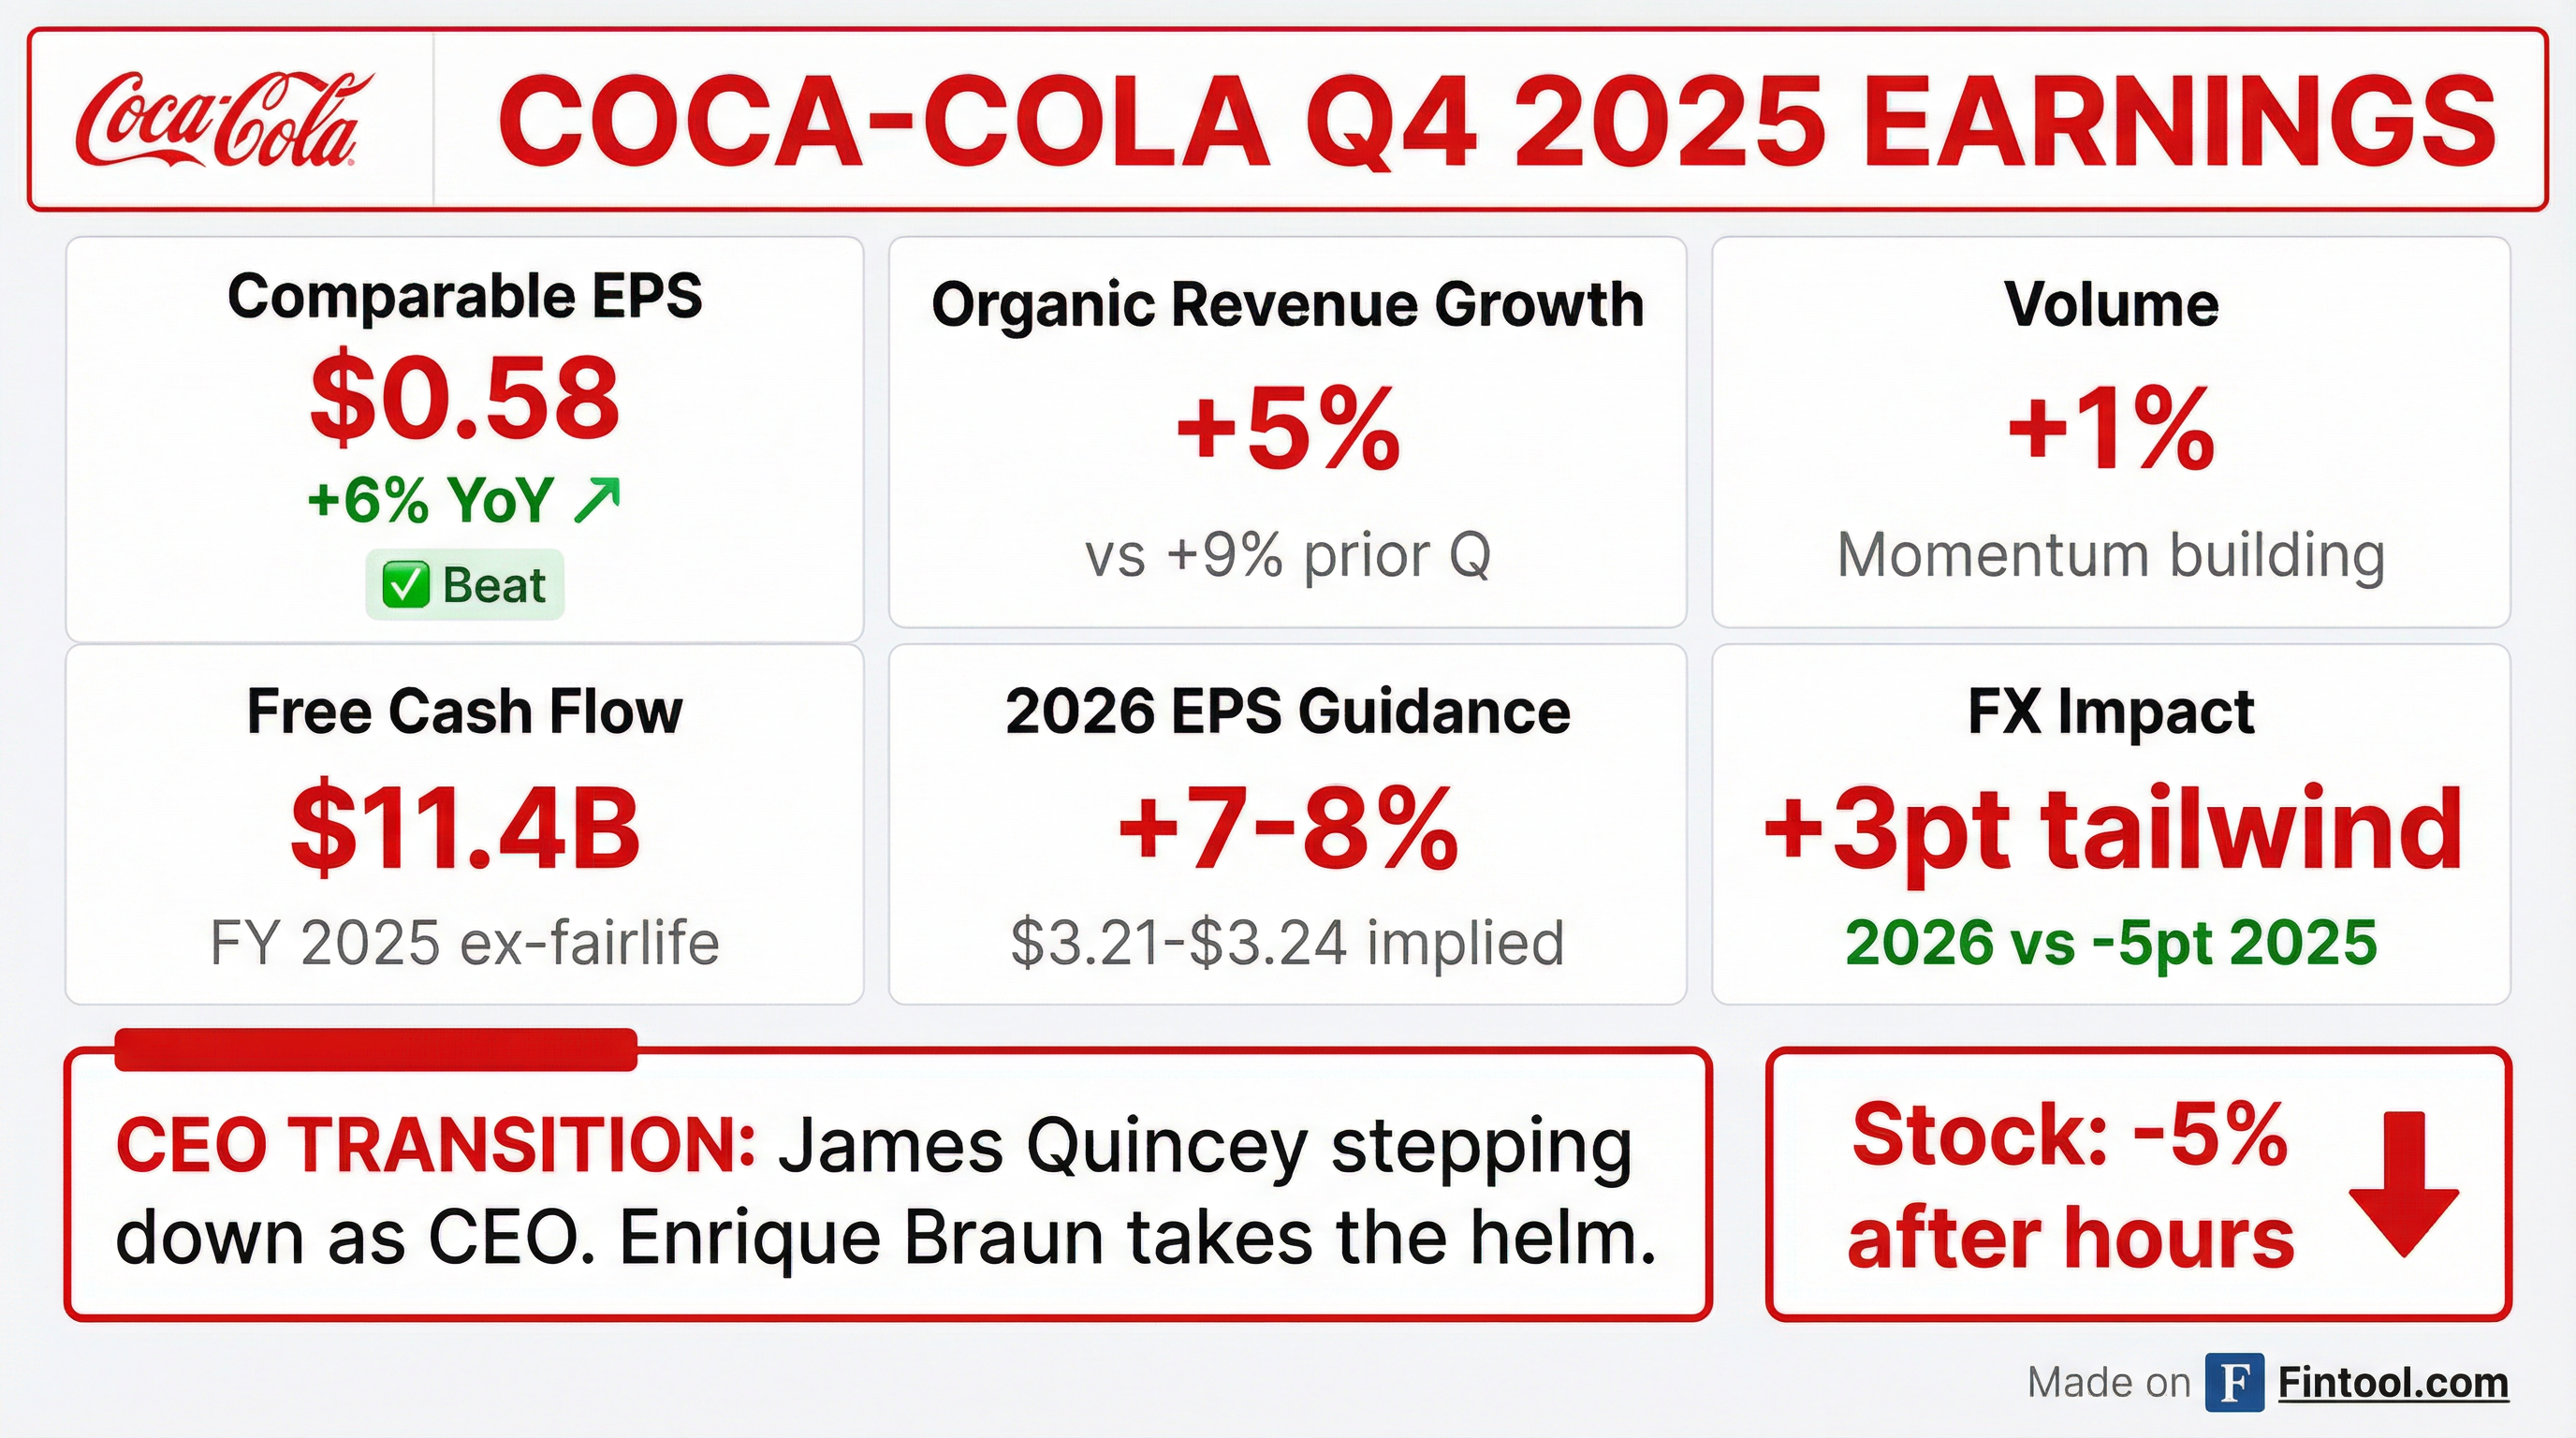
- Q4 2025 financials: organic revenues +5%, unit case volume +1%, price/mix +1%, comparable EPS $0.58 (+6% YoY), free cash flow $11.4 B, and net debt leverage 1.6×.
- 2026 guidance: organic revenue growth of 4–5%, comparable EPS growth of 7–8% to a base of $3 in 2025, and free cash flow of ~$12.2 B with ~$2.2 B in capital investments.
- Leadership change: James Quincey steps down with Q4 call as CEO, transitioning to Executive Chair; Enrique Braun named next CEO of The Coca-Cola Company.
- Capital allocation emphasizes long-term investment and shareholder returns: 63 years of consecutive dividend increases (2025 payout ratio 73% of adj. FCF), disciplined share buybacks, and growth-oriented capex including bottler investments.
- Strategic positioning includes a portfolio of 32 billion-dollar brands (75% outside sparkling), 7% avg. organic revenue growth since 2017, and focus on digitization, franchising, and consumer engagement.
Fintool News
In-depth analysis and coverage of COCA COLA.


Quarterly earnings call transcripts for COCA COLA.
Ask Fintool AI Agent
Get instant answers from SEC filings, earnings calls & more