Earnings summaries and quarterly performance for Mondelez International.
Executive leadership at Mondelez International.
Dirk Van de Put
Chief Executive Officer
Gustavo Valle
Executive Vice President and President, North America
Laura Stein
Executive Vice President, Corporate & Legal Affairs; General Counsel and Corporate Secretary
Luca Zaramella
Executive Vice President and Chief Financial Officer
Stephanie Lilak
Executive Vice President and Chief People Officer
Volker Kuhn
Executive Vice President and President, Europe
Board of directors at Mondelez International.
Brian J. McNamara
Director
Cees 't Hart
Director
Ertharin Cousin
Director
Jane Hamilton Nielsen
Director
Jorge S. Mesquita
Director
Michael A. Todman
Director
Nancy McKinstry
Director
Patrick T. Siewert
Lead Independent Director
Paula A. Price
Director
Research analysts who have asked questions during Mondelez International earnings calls.
Andrew Lazar
Barclays PLC
9 questions for MDLZ
Peter Galbo
Bank of America
9 questions for MDLZ
David Palmer
Evercore ISI
7 questions for MDLZ
Megan Clapp
Morgan Stanley
6 questions for MDLZ
Chris Carey
Wells Fargo Securities
4 questions for MDLZ
Kenneth Goldman
JPMorgan Chase & Co.
3 questions for MDLZ
Alexia Howard
AllianceBernstein
2 questions for MDLZ
Christopher Carey
Wells Fargo & Company
2 questions for MDLZ
Max Gumport
BNP Paribas
2 questions for MDLZ
Michael Lavery
Piper Sandler & Co.
2 questions for MDLZ
Robert Moskow
TD Cowen
2 questions for MDLZ
Scott Marks
Jefferies
2 questions for MDLZ
Thomas Palmer
Citigroup Inc.
2 questions for MDLZ
Tom Palmer
JPMorgan Chase & Co.
2 questions for MDLZ
John Baumgartner
Mizuho Securities
1 question for MDLZ
Max Andrew Gumport
BNP Paribas
1 question for MDLZ
Megan Christine Alexander
Morgan Stanley
1 question for MDLZ
Recent press releases and 8-K filings for MDLZ.
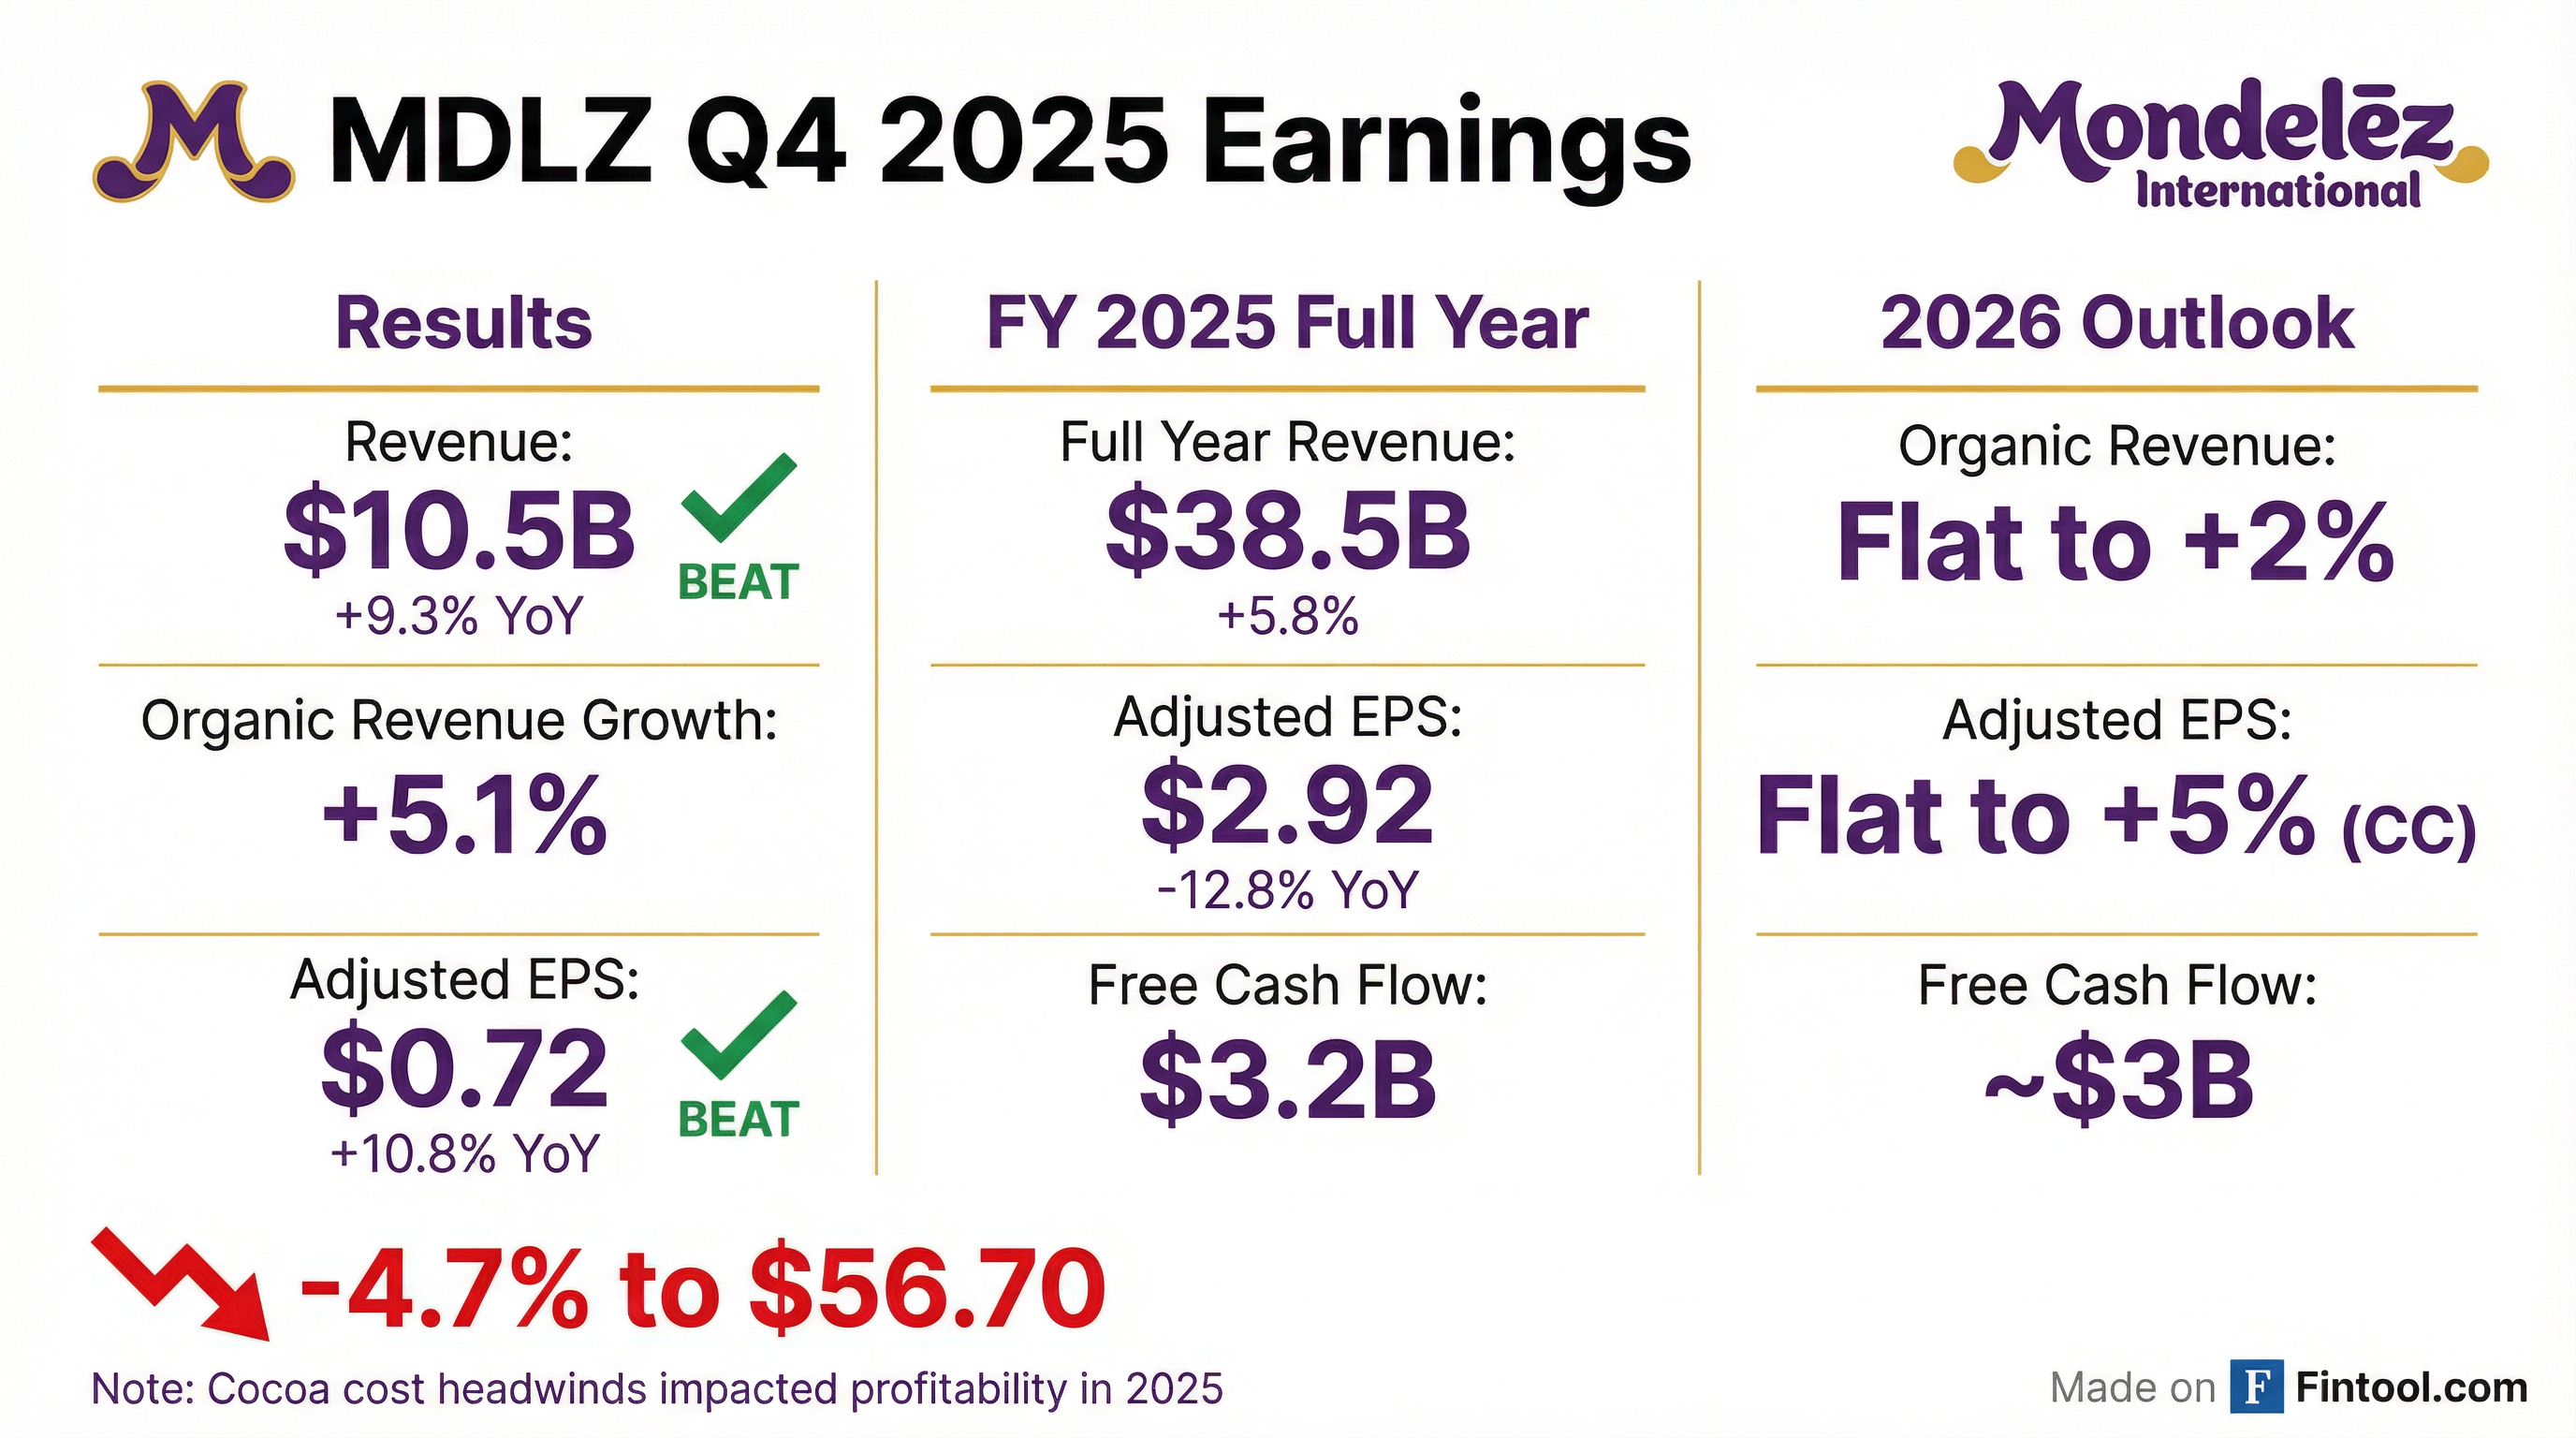
- Q4 revenue of $10.5 billion and adjusted EPS of $0.72 topped estimates.
- 2026 guidance: organic revenue flat to 2% and adjusted EPS flat to up 5%, with a one-time $1 billion inventory accounting adjustment weighing on Q1.
- Cocoa costs largely hedged at higher prices, so spot-price declines won’t yield near-term savings; expects chocolate margins to recover materially in 2027.
- Noted weakness in U.S. biscuit volumes (down ~4% over three months) amid muted demand; plans to boost advertising and consumer investment after 2025 cuts.
- Mondelēz executed its chocolate price-pack architecture playbook in 2025 but saw higher than expected elasticity in northern Europe, prompting repricing, renewed innovation (notably Biscoff), and increased brand investments for 2026; with cocoa prices having fallen sharply, the company expects a significant margin uplift in 2027 as earlier‐locked costs roll off.
- The 2026 guidance calls for 0–2% organic net revenue growth with flat chocolate pricing, and includes a $500 million Q1 headwind from inventory revaluation as 2026 cocoa pipeline costs reset lower than 2025 exit levels; flexibility is built in for potential competitor reactions to the cocoa price decline.
- In North America, consumer confidence near historic lows has driven shoppers toward value channels and multi-packs, causing biscuit volumes to fall; Mondelēz plans to boost media spend, optimize promotions, expand into under-indexed channels, and modernize its supply chain to restore volume and margin growth.
- Emerging markets delivered high-single-digit growth in 2025, and while Argentina’s economic turmoil masked regional performance, Mondelēz expects Latin America and EMEA to sustain volume momentum in 2026 through mix improvements and reduced elasticity from prior price increases.
- 2026 guidance embeds 0–2% organic sales growth, with prudence for U.S. biscuit softness and European chocolate stability amid customer negotiations; includes a $500 million Q1 headwind from cocoa inventory revaluation as pipeline costs lock above spot.
- Cocoa prices plunged unexpectedly, pressuring short-term margins but positioning for significant margin expansion in 2027; the company is fully covered for 2026 at higher costs and maintains flexibility depending on competitor reactions.
- Chocolate strategy for 2026 emphasizes price‐point adjustments, stepped-up brand investments and innovation-led initiatives (notably Biscoff collaborations), plus in-store activations to rebuild consumption frequency and volume.
- North America faces low consumer confidence and a −4% biscuit volume decline in Q4; the response focuses on targeted promotions, channel expansion, premium snacking growth (e.g., Perfect Bar, Tate’s) and supply‐chain modernization, without broad-based price cuts.
- Mondelēz delivered Q4 2025 organic net revenue growth of +5.1%, led by cocoa-driven pricing (+9.9pp) offset by volume/mix declines (-4.8pp).
- Q4 adjusted EPS was $0.72, up 4.6% at constant currency, driven by cost discipline and lapping high cocoa costs.
- Full-year free cash flow reached $3.2 B, and the company deployed $4.9 B in dividends and share repurchases in 2025.
- For 2026, Mondelēz expects organic net revenue growth flat to +2%, adjusted EPS growth flat to +5%, and free cash flow of about $3 B.
- Mondelēz executed its 2025 chocolate strategy via list-price increases and price-pack architecture, but will adjust in northern Europe in 2026, boost brand investment on lower cocoa costs, and remain agile to competitor moves given 2026 hedged cocoa at higher than spot prices.
- 2026 guidance assumes 0–2% organic sales growth, with a $500 million Q1 non-cash inventory charge from cocoa pipeline revaluation, stable U.S. biscuits in H1, stable European chocolate after customer negotiations, and neutral-to-positive pricing net of cost in chocolate.
- Emerging markets momentum remains strong (high-single-digit growth in LATAM and EMEA ex-Argentina), while North America faces a 4% biscuit volume decline, to be addressed by higher A&C investment, targeted price-pack offers, channel expansion, and a multi-year supply-chain efficiency program.
- Looking to 2027, a cocoa price reset to ~$3,000/ton underpins a significant chocolate margin recovery, funding a mix of reinvestment and EPS growth, alongside stepped-up A&C spend through 2027 to drive sustained volume gains.
- In Q4 2025, net revenues were $10.496 billion, up 9.3% (organic +5.1%), and diluted EPS was $0.51, down 60.8%; adjusted EPS was $0.72, up 4.6% on a constant currency basis.
- For FY 2025, net revenues reached $38.537 billion, up 5.8% (organic +4.3%), while diluted EPS declined 44.7% to $1.89 and adjusted EPS fell 14.6% to $2.92 on a constant currency basis.
- The company generated $4.5 billion of operating cash flow and $3.2 billion of free cash flow, and returned $4.9 billion to shareholders via dividends and share repurchases in FY 2025.
- For 2026, Mondelez expects organic net revenue growth of 0–2%, adjusted EPS growth of 0–5% on a constant currency basis, and free cash flow of approximately $3 billion.
- Armis wurde erneut in die Fortune Cyber 60 aufgenommen, einer Rangliste führender VC-finanzierter Cybersicherheitsunternehmen, präsentiert von Lightspeed, Fortune Magazine und AWS.
- Das Unternehmen hat einen jährlichen wiederkehrenden Umsatz (ARR) von 300 Mio. USD überschritten, den Geschäftsbereich Armis Federal eingeführt und seine dritte Akquisition innerhalb von 12 Monaten abgeschlossen.
- Armis wurde als Leader in der Forrester Wave™: IoT Security Solutions Q3 2025 und in der Forrester Wave™: Unified Vulnerability Management Solutions Q3 2025 ausgezeichnet sowie im Gartner® Magic Quadrant™ for CPS Protection Platforms positioniert.
- Das Unternehmen betreut tausende Kunden, darunter United Airlines, Colgate Palmolive und Mondelez, sowie über ein Drittel der Fortune 100 und 60 % der Fortune 10.
- Europe saw stable consumer confidence but faced pressure after ~30% cocoa-driven price increases, leading to higher than expected price elasticity of 0.7–0.8 (vs. historical 0.4–0.5) and volume declines in the UK and Germany due to heat waves and competitive price gaps.
- North America volumes declined 4% (vs. 2.8% YTD) as consumers traded down to smaller packs and value channels; the company is adjusting price points (e.g., $3 packs), expanding in club/value/online, and doubling down on 20%+ growth protein and premium segments.
- Emerging markets volume was down 4.7%, driven by Argentina’s hyperinflation and Indian downsizing; excluding those, volumes fell 3%, with Brazil up double-digits, Mexico mid-single-digits, and China down low single-digits in Q3.
- 2025 guidance implies Q4 organic net revenue growth of >4%, over-delivering on EPS versus 2024 due to a non-recurring $0.08 tax benefit and anticipated cocoa cost relief; targeting high single-digit EPS growth in 2026 amid continued brand and supply-chain investments.
- Q3 organic net revenue grew +3.4%, led by pricing (+8.0pp) and offset by volume/mix (-4.6pp); the company updated its FY 2025 outlook to 4%+ organic growth and ~ -15% adjusted EPS decline on a constant-FX basis.
- Adjusted EPS at constant FX was $0.72, down 24.2% year-over-year, primarily driven by higher cocoa input costs.
- By segment, Chocolate posted +8.2% organic growth, Biscuits & Baked Snacks +1.2%, and Gum & Candy +2.4% in Q3 2025.
- Regional organic net revenue growth: Europe +5.1%, AMEA +5.3%, Latin America +4.7%, and North America -0.3% in Q3 2025.
- Q3 global volumes pressured: North America down 4% vs 2.8% YTD average, while Europe chocolate price elasticity reached 0.7–0.8, above the 0.4–0.5 plan, driven by ~30% cocoa-led price hikes.
- North American snacking volumes hit by consumer cost concerns, muted promo ROI and shifts to value clubs/online; growth levers include multipacks, protein bars (+20%+ growth) and premium brands (Tate’s, Belvita) under a new pack-price architecture.
- Europe delivered share and mix gains in biscuits and cakes but saw UK/Germany pockets of pressure from competitive price gaps and a July heat wave; management is repositioning key price points, innovating with new formats and intensifying seasonal promotions.
- Guidance update: 2025 outlook trimmed on tariffs, U.S. retailer destocking and European heat wave, with implied Q4 organic growth >4% and EBIT over-delivery (no prior-year $0.08 tax drag). For 2026, management targets high single-digit EPS growth amid deflationary cocoa, ongoing brand investments and a multi-year North America supply-chain productivity program (peaking in 2027).
Fintool News
In-depth analysis and coverage of Mondelez International.

Quarterly earnings call transcripts for Mondelez International.
Ask Fintool AI Agent
Get instant answers from SEC filings, earnings calls & more