Earnings summaries and quarterly performance for AT&T.
Executive leadership at AT&T.
John Stankey
Chief Executive Officer
David McAtee
Senior Executive Vice President and General Counsel
Jeff McElfresh
Chief Operating Officer
Lori Lee
Global Marketing Officer and Senior Executive Vice President-HR and International
Pascal Desroches
Senior Executive Vice President and Chief Financial Officer
Board of directors at AT&T.
Research analysts who have asked questions during AT&T earnings calls.
Benjamin Swinburne
Morgan Stanley
7 questions for T
John Hodulik
UBS Group AG
7 questions for T
Michael Rollins
Citigroup
7 questions for T
Peter Supino
Wolfe Research
7 questions for T
Sebastiano Petti
JPMorgan Chase & Co.
7 questions for T
Michael Ng
Goldman Sachs
4 questions for T
David Barden
Bank of America
3 questions for T
Bryan Kraft
Deutsche Bank AG
2 questions for T
Drew McReynolds
RBC Capital Markets
2 questions for T
James Schneider
Goldman Sachs
2 questions for T
Jérome Dubreuil
Desjardins Group
2 questions for T
Kannan Venkateshwar
Barclays PLC
2 questions for T
Maher Yaghi
Scotiabank
2 questions for T
Michael Funk
Bank of America
2 questions for T
Samuel McHugh
BNP Paribas
2 questions for T
Stephanie Price
CIBC World Markets
2 questions for T
Vince Valentini
TD Securities
2 questions for T
John Hudlick
UBS
1 question for T
Timothy Horan
Oppenheimer & Co. Inc.
1 question for T
Recent press releases and 8-K filings for T.
- AT&T Inc. priced a CAD$1.25 billion 4.500% global note due March 12, 2036 at 99.777% of par.
- The company also priced a CAD$1.00 billion 5.250% global note due March 12, 2056 at 99.402% of par.
- Interest is payable semiannually on March 12 and September 12, commencing September 12, 2026, with make-whole calls before the par-call dates and par redemption thereafter.
- Net proceeds (approx. CAD$1.242 billion and CAD$989 million) will fund general corporate purposes, including debt repayment and pending acquisitions; underwriters will reimburse CAD$1 million of AT&T’s expenses.
- KBRA has assigned preliminary ratings to Series 2026-1 Notes from Metronet Infrastructure Issuer, LLC, marking the fifth rated series under its July 2025 master trust and reflecting stable cash flow analysis.
- The transaction is collateralized by fiber-to-the-premises networks and related contracts, with annualized revenue of approximately $561.3 million and net Annualized Run Rate Revenue of about $406.5 million after senior expenses.
- A FTTP master framework agreement obligates T-Mobile to remit monthly recurring charges for residential services to Metronet’s MFA Supplier Group, representing over two-thirds of pro-forma revenue, with commercial customers comprising the remainder.
- KBRA expects to affirm ratings on all prior series (2025-1 through 2025-4) alongside the Series 2026-1 issuance, consistent with its cash flow analysis.
- AT&T commits $250 billion through 2030 to expand and upgrade U.S. telecom infrastructure, more than doubling prior multi-year capex estimates (~$111.6 billion).
- The plan targets 60 million fiber locations by 2030 (≈40 million by year-end), deepens an AST SpaceMobile satellite tie-up, strengthens FirstNet for first responders, and shifts from copper to fiber and wireless.
- The company will recruit and train thousands of technicians within its ~110,000-strong U.S. workforce, emphasizing skills-based hiring and AI-native talent.
- AT&T previously allocated $145 billion for expansion and coverage between 2021 and 2025, underscoring the scale-up in its new pledge.
- AT&T pledges $250 billion over five years to build and modernize its fiber and wireless network, targeting coverage for 100 million customers on the nation’s largest converged network.
- The funds will accelerate deployment of fiber, 5G home internet, wireless and satellite services (in partnership with AST SpaceMobile), strengthen FirstNet for first responders, and enhance network security and resilience.
- The company will invest in its ~110,000 U.S. employees, hiring thousands of technicians in 2026 and funding training, upskilling, and career development to support its expanded infrastructure.
- AT&T expects to end 2026 with over 40 million fiber passings (up from 36 million post-Lumen) and a 5 million passings annual build rate, targeting over 50 million by the end of its three-year guidance period.
- Integration of the Lumen Mass Markets assets (4 million passings, 1 million subscribers, ~25% penetration) will weigh on Q1 2026 results, with EBITDA growth in the low single digits and free cash flow of $2–$2.5 billion due to integration and transaction costs.
- Starting in Q1 2026, AT&T will report in two segments—advanced connectivity and legacy communications—to better showcase returns on fiber/5G investments and progress on sunsetting copper.
- Capital allocation includes an annual $8 billion dividend, $8 billion in share buybacks over the next three years, and a target of 2.5× net debt/EBITDA within three years, preserving flexibility for strategic investments.
- AT&T will focus on integrating the Lumen Mass Markets assets (4 million passings, 1 million subs), closing the EchoStar deal, and ramping its fiber network to 40 million passings by year-end—building at a 5 million passings annual pace toward 50 million over the next three years.
- Beginning in Q1 2026, AT&T will report under two segments—Advanced Connectivity (fiber/5G investments) and Legacy Communications—to better highlight returns on its growth assets and progress in sunsetting copper.
- Q1 2026 is expected to deliver low-single-digit EBITDA growth and $2 billion–$2.5 billion free cash flow due to integration and transaction costs; full-year targets include >30% advanced home internet revenue growth and 2–3% wireless service revenue growth.
- Capital allocation for 2026 assumes >$18 billion in free cash flow directed to an $8 billion dividend and $8 billion share buyback, with a path to reduce net leverage to 2.5× within three years while preserving capacity for strategic investments.
- AT&T will focus in 2026 on integrating the Lumen Mass Markets assets, closing the EchoStar spectrum deal, and executing its fiber build to reach 4 million organic passings and a 5 million passings annual run rate by year-end, targeting 40 million total passings by exit 2026.
- In Q1 2026, consolidation of Lumen’s 4 million passings (at 25% penetration vs. 40% in AT&T’s core) will lower reported penetration and convergence rates, with EBITDA growth of low single digits and free cash flow of $2 billion–$2.5 billion after integration and transaction costs.
- Beginning in Q1, AT&T will report in two segments—Advanced Connectivity and Legacy Communications—to spotlight returns on fiber/5G investments and track the wind-down of its legacy network.
- Over the next three years, AT&T plans to expand to over 50 million fiber passings (with 5 million annual builds), funded by strong free cash flow after an $8 billion dividend, $8 billion buybacks, and aiming to reduce leverage to 2.5× EBITDA while retaining flexibility for strategic opportunities.
- Pascal Desroches, AT&T’s CFO, will speak on March 9 at 8:00 a.m. ET at the Deutsche Bank Media, Internet & Telecom Conference to review the company’s progress on its multi-year growth strategy.
- Beginning with Q1 2026, AT&T will report three new segments—Advanced Connectivity (≈ 90% of 2025 revenues), Legacy and Latin America—to improve visibility into its 5G and fiber investments.
- The company closed its acquisition of Lumen’s Mass Markets fiber business on February 2, adding over 1 million fiber customers across 4 million locations, which will be reflected in Q1 2026 results.
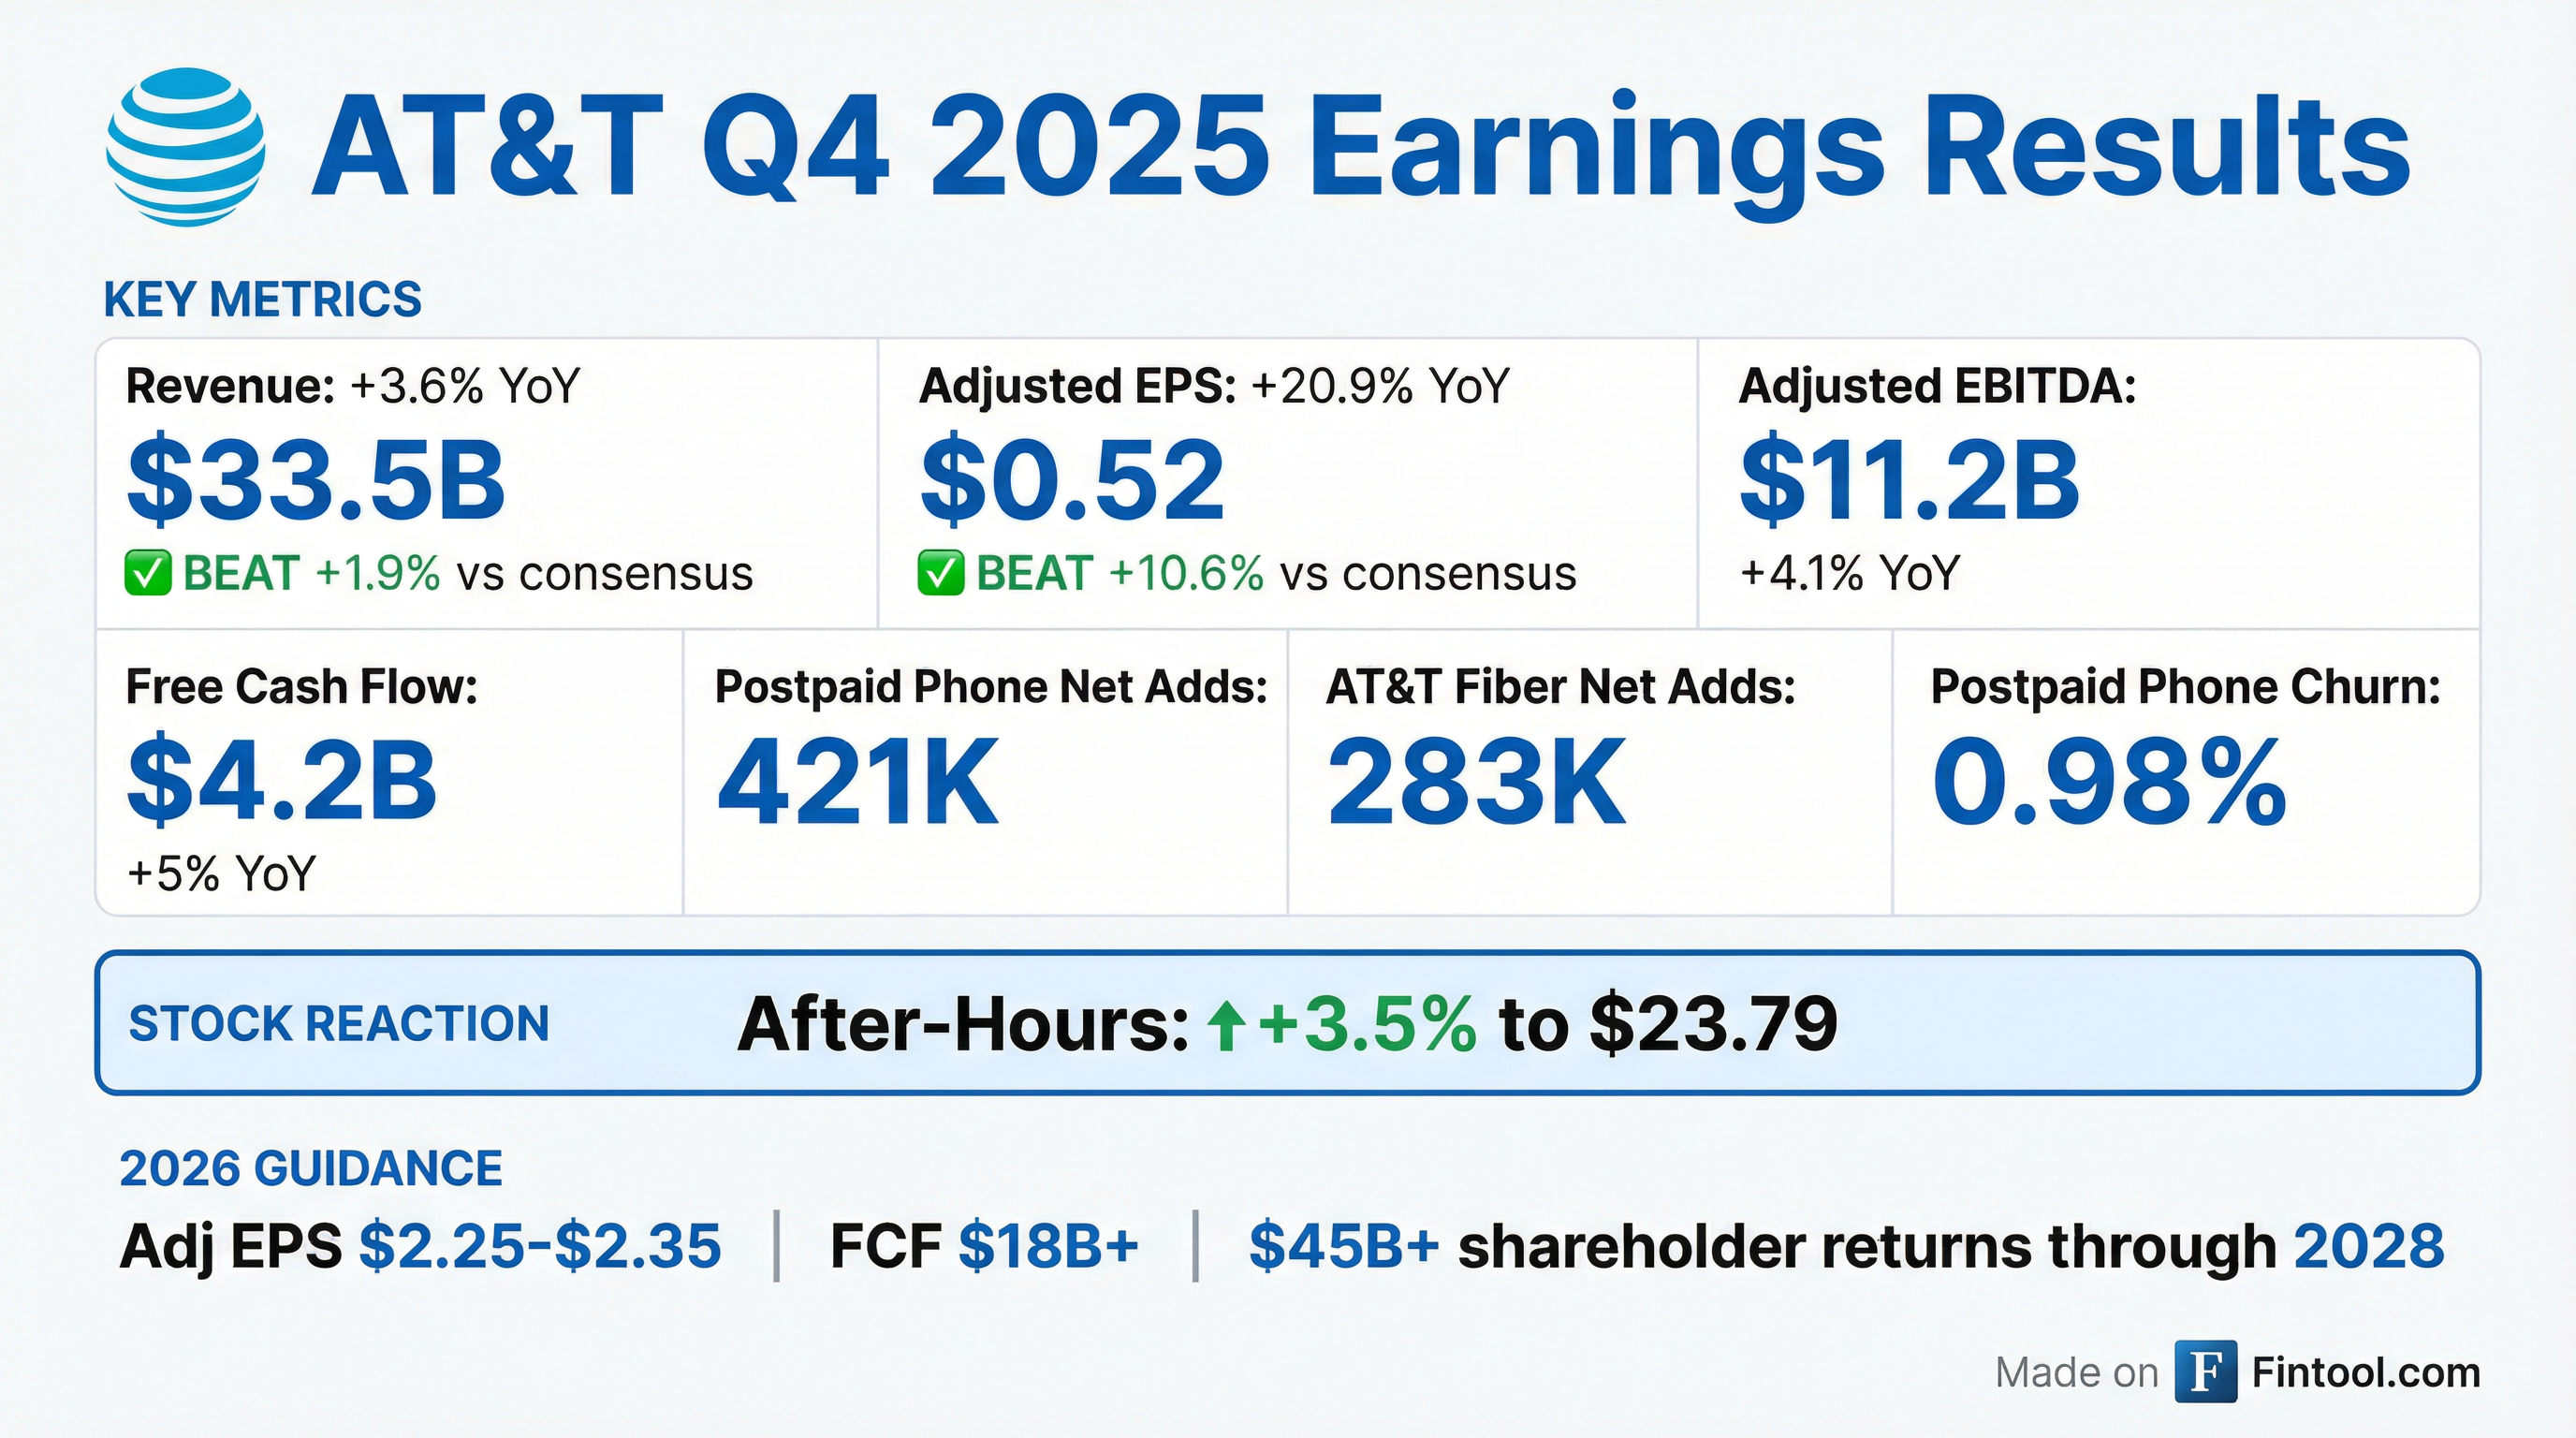
- AT&T reiterates its 2026 targets: Q1 free cash flow of $2.0–2.5 billion, full-year adjusted EBITDA growth of 3–4%, and $45 billion+ in shareholder returns through 2028.
- Following its EchoStar transaction, AT&T expects net debt/adjusted EBITDA of ≈ 3.2x, declining to ≈ 3.0x by year-end 2026.
- CEO succession on track: Victor will join as CEO designate in May and assume full responsibilities in July, with management focused on executing current strategic plans and further deleveraging.
- Wireless outlook: Subscriber growth in 2026 is expected to mirror 2025 levels amid slower immigration; ARPU will continue improving but may not reach positive growth by year-end, as TELUS emphasizes value-based bundles over aggressive loading tactics.
- Fiber and capital intensity: Capital spending is targeted at ≤10% of revenue, reflecting largely completed fiber builds in core markets; future investments will shift toward AI and digital platforms while copper networks are phased out regionally.
- Deleveraging and Health monetization: Net debt/EBITDA is projected to fall to 3.3x by end-2026 and 3.0x by 2027, supported by tower transactions and potential asset sales; TELUS Health is in a formal sale process with over 75 inbound interests and pitch books due within 30 days.
- Digital strategy: TELUS Digital will refocus on external AI and digital solutions, reintegrating customer-experience services into core operations while exploring future transaction options for the external CX business.
- AT&T reconfirmed its multi-year guidance with 2–3% wireless service revenue growth through 2028 (volume-driven) and 3–4% EBITDA growth in 2026, ramping to 5%+ by 2028, backed by a $4 billion cost reduction target.
- AT&T’s convergence strategy drives growth: it serves customers across 36 million fiber passings, expects 40 million by year-end, and emphasizes fiber + wireless bundles that deliver industry-leading brand love, NPS and low churn.
- Closed the Lumen Mass Markets acquisition, adding 4 million passings, and is scaling its Gigapower build engine to 1 million passings per year to exceed 60 million total fiber passings by 2030.
- Advancing wireless network modernization, with half of radio rip-and-replace complete and full deployment in 18 months, yielding higher throughput, better reliability, lower operating costs and opening the network to new hardware vendors.
- Accelerating copper network decommissioning, with 85% of wire centers discontinued for sale and 30% cleared for full shutdown, and introducing new reporting to separate Advanced Connectivity from legacy services to track migration progress.
Fintool News
In-depth analysis and coverage of AT&T.

AT&T CFO Lays Out Fiber-First Playbook at Barclays: 60M Locations by 2030, Accretion in 2028

AT&T and Amazon Forge 'Fiber-to-Space' Alliance to Challenge Starlink Dominance

AT&T Abandons Downtown Dallas for Suburban Plano in $2.7 Billion Property Value Shock
Quarterly earnings call transcripts for AT&T.
Ask Fintool AI Agent
Get instant answers from SEC filings, earnings calls & more