Earnings summaries and quarterly performance for CLOROX CO /DE/.
Executive leadership at CLOROX CO /DE/.
Linda Rendle
Chief Executive Officer
Angela Hilt
Executive Vice President and Chief Legal and External Affairs Officer & Corporate Secretary
Chris Hyder
Executive Vice President and Group President – Health & Hygiene
Kirsten Marriner
Executive Vice President and Chief Administrative Officer
Luc Bellet
Executive Vice President and Chief Financial Officer
Nina Barton
Executive Vice President and Group President – Care & Connection
Stacey Grier
Executive Vice President and Executive Chief of Staff
Board of directors at CLOROX CO /DE/.
Christopher Williams
Director
David Mackay
Director
Esther Lee
Director
Gina Boswell
Director
Julia Denman
Director
Matthew Shattock
Lead Independent Director
Pierre Breber
Director
Russell Weiner
Director
Stephanie Plaines
Director
Stephen Bratspies
Director
Research analysts who have asked questions during CLOROX CO /DE/ earnings calls.
Andrea Teixeira
JPMorgan Chase & Co.
8 questions for CLX
Bonnie Herzog
Goldman Sachs
8 questions for CLX
Filippo Falorni
Citigroup Inc.
8 questions for CLX
Kaumil Gajrawala
Jefferies
8 questions for CLX
Kevin Grundy
BNP Paribas
8 questions for CLX
Peter Grom
UBS Group
8 questions for CLX
Robert Moskow
TD Cowen
8 questions for CLX
Anna Lizzul
Bank of America Corporation
7 questions for CLX
Christopher Carey
Wells Fargo & Company
6 questions for CLX
Olivia Tong Cheang
Raymond James Financial, Inc.
6 questions for CLX
Javier Escalante Manzo
Evercore ISI
5 questions for CLX
Lauren Lieberman
Barclays
5 questions for CLX
Dara Mohsenian
Morgan Stanley
3 questions for CLX
Edward Lewis
Redburn Atlantic
2 questions for CLX
Olivia Tong
Raymond James
2 questions for CLX
Stephen Robert Powers
Deutsche Bank
2 questions for CLX
Anna Jeanne Lizzul
Bank of America
1 question for CLX
Chris Carey
Wells Fargo Securities
1 question for CLX
Christopher Michael Carey
Wells Fargo Securities
1 question for CLX
Javier Escalante
Evercore Inc.
1 question for CLX
Linda Bolton-Weiser
D.A. Davidson & Co.
1 question for CLX
Stephen Powers
Deutsche Bank
1 question for CLX
Steve Powers
Deutsche Bank
1 question for CLX
Recent press releases and 8-K filings for CLX.
- $70 M Series B led by Two Sigma Ventures, bringing total capital raised to $130 M
- Investors include Valor, Atreides, Amplo, Alumni Ventures, Collab Fund, Lumina Partners, and Patrick Collison, alongside existing backers
- Plans to scale its AI-powered olfaction technology across fragrance, healthcare, and public safety sectors to reduce costs and accelerate time-to-market
- New executive appointments: Mike Rytokoski (CCO), Mateusz Brzuchacz (COO), Nate Pearson (CFO); board addition Boet Brinkgreve
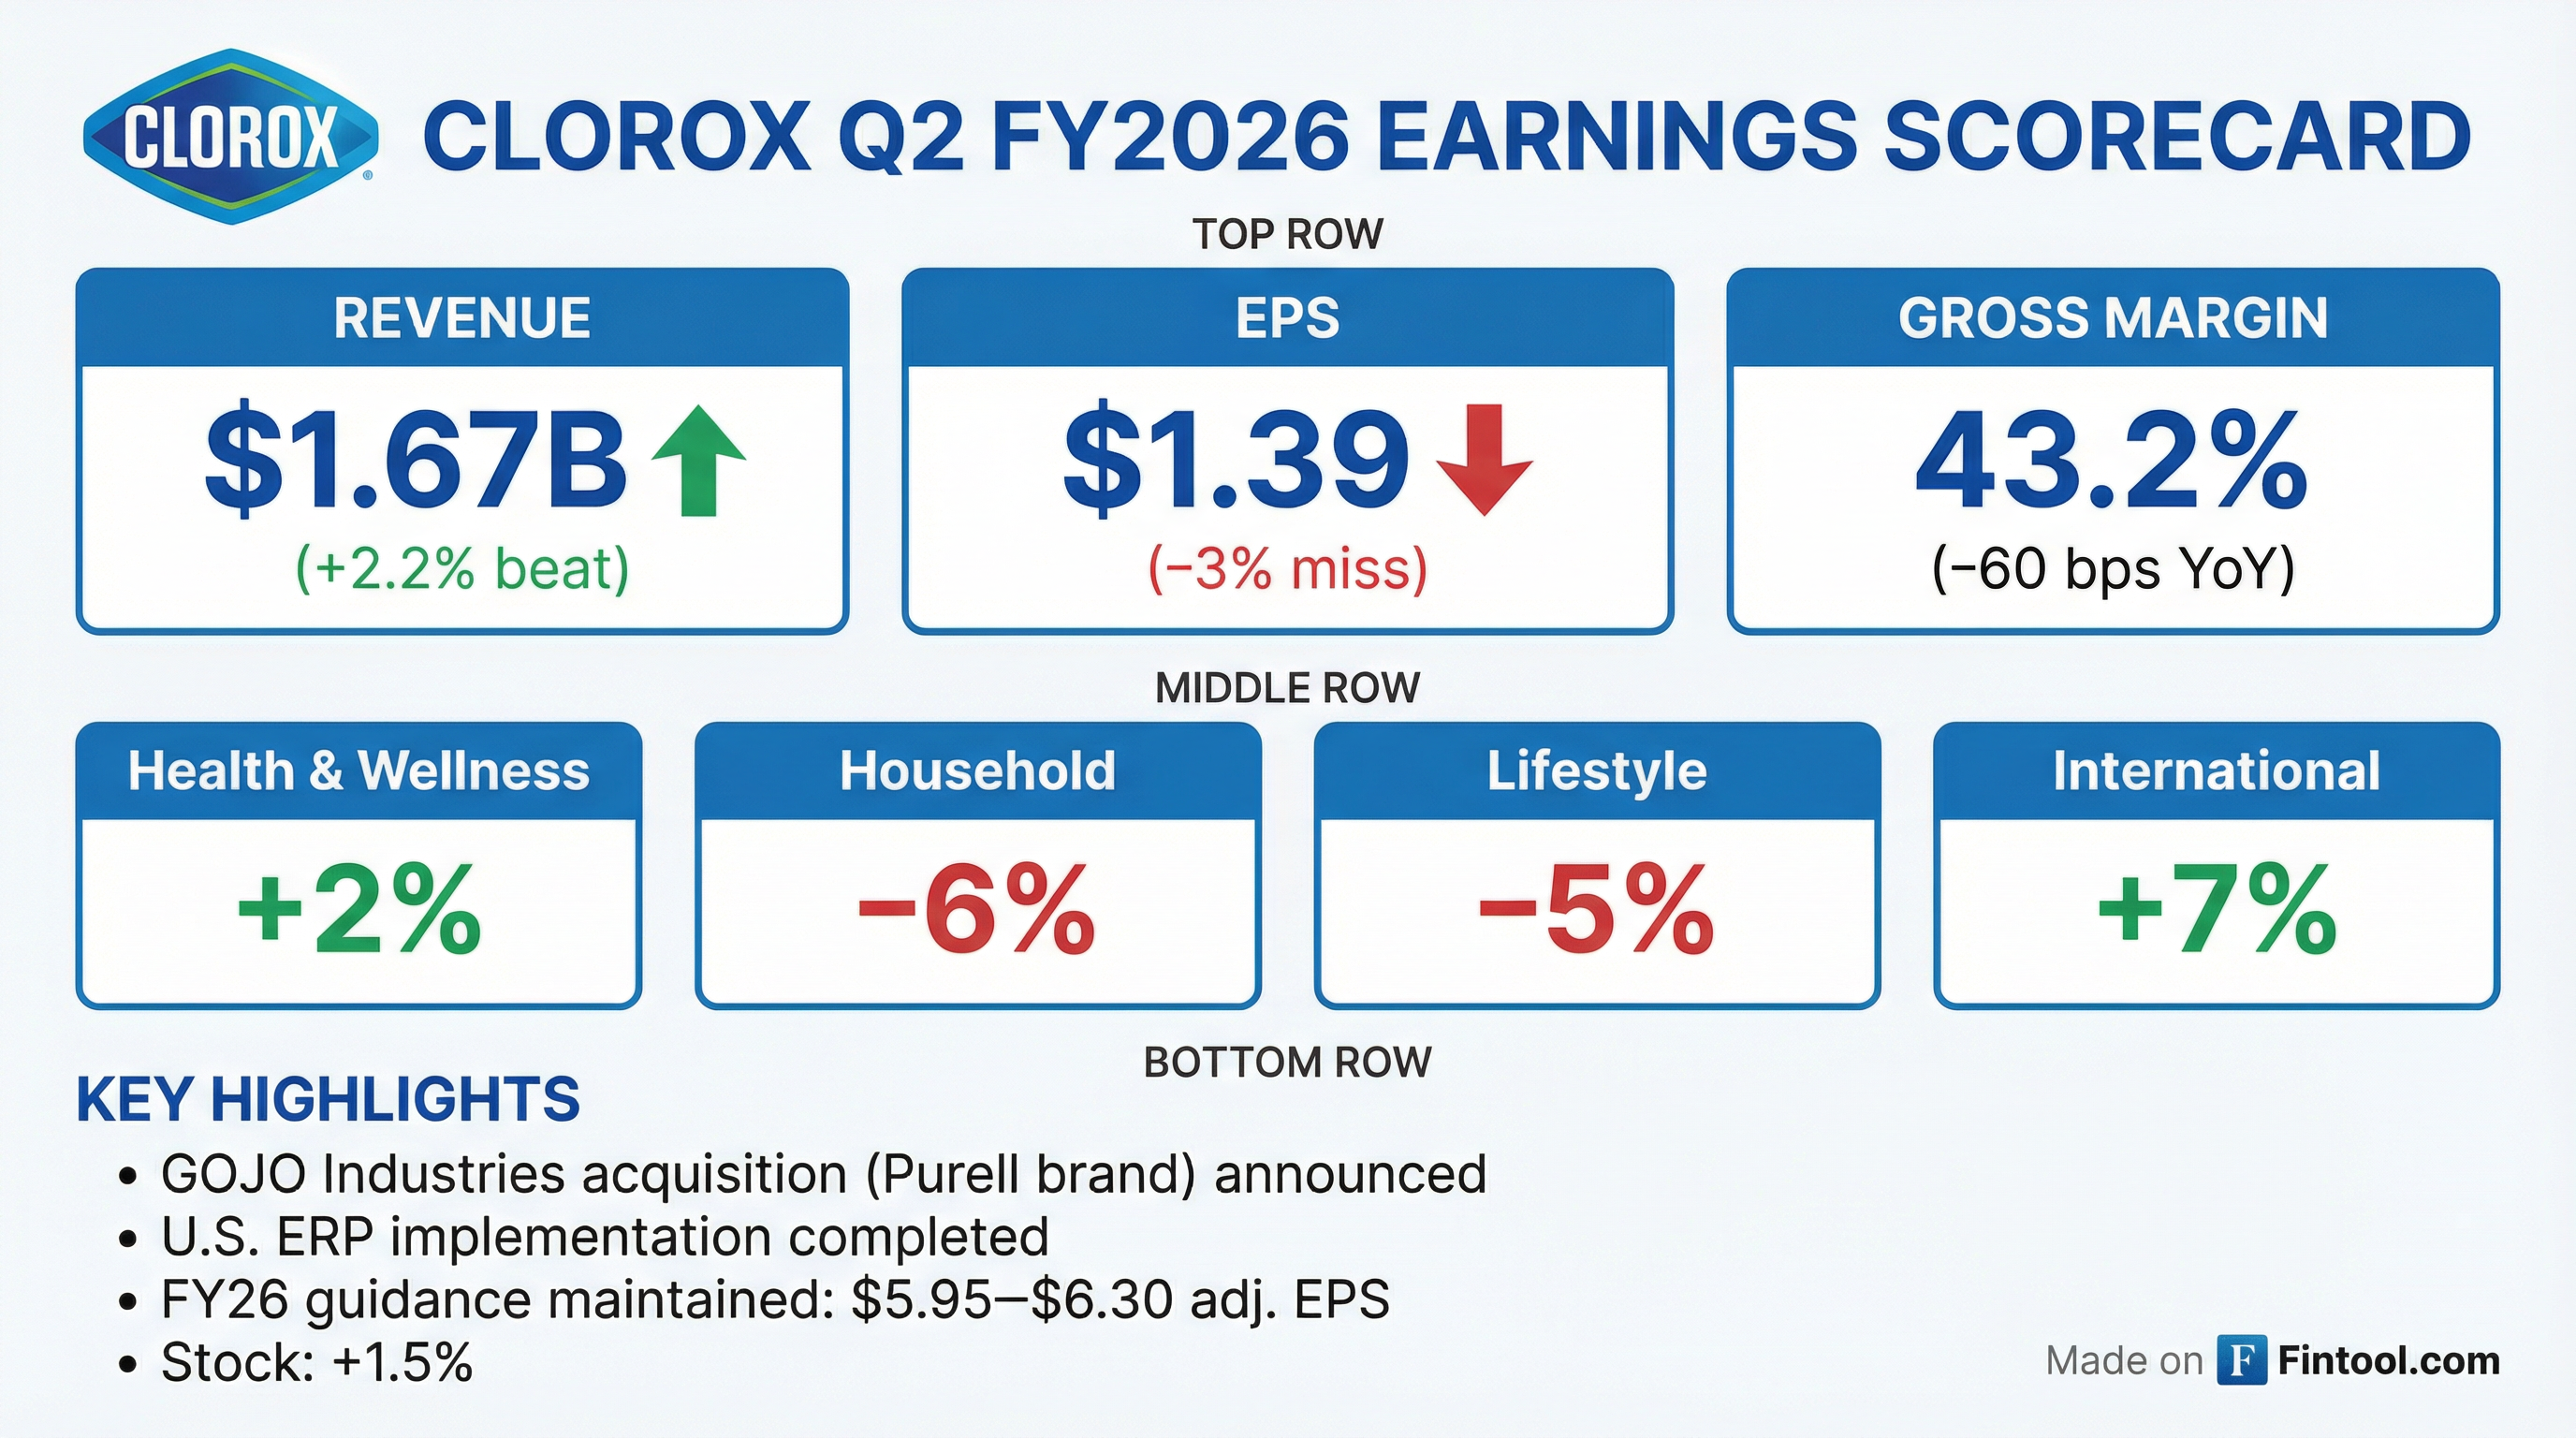
- Clorox posted $1.67 billion in Q2 revenue, flat y/y, with net income of $157 million (GAAP EPS $1.29, down from $1.54) and non-GAAP EPS of $1.39, missing estimates by ~$0.04.
- Company confirmed FY26 diluted EPS guidance of $5.60 to $5.95 and projects net sales to decline 6%–10%, citing lapping insurance recoveries and weaker shipments.
- Announced acquisitions of GOJO Industries for $2.25 billion and P&G’s Glad business for $476 million, to be funded primarily with debt, raising leverage considerations.
- Shares fell approximately 2.4% in after-hours trading following the profit miss and cautious outlook.
- Sequential improvement in Q2 with category growth flat in Q1–Q2 and 0–1% growth expected in H2; leveraging innovation and demand plans for improved share performance.
- Gross margin projected to expand in H2 as ERP-related costs unwind by Q4, cost-savings run-rate accelerates, and GLAD JV termination adds 50 bps; margins flat in Q3, stronger in Q4.
- Company expects a ~1% price/mix headwind for the full year but employs selective price investments (e.g., trash bags, home care) and new RGM capabilities to optimize price-pack architecture.
- ERP implementation completes end of Q3 with remaining transition costs phasing out by Q4; focus shifts to supply-chain and admin automation and process optimization to support further margin gains.
- Confirmed sequential improvement and reaffirmed FY 2026 guidance with category growth flat in Q2 (down 0.1% ex-beauty) and expected 0–1% growth in the back half.
- Completed ERP implementation in January, with $0.08 per share of digital transformation adjustments remaining in Q3 before productivity gains thereafter.
- Competitive promotion normalized to pre-COVID levels, with elevated promotional intensity in cat litter and trash bags (including large Costco Scoop Away events), managed through strategic, disciplined promotions.
- Strong back-half innovation pipeline across core brands (Glad, Fresh Step, Hidden Valley) featuring price-pack architecture updates and new SKUs (e.g., Avocado Ranch) to drive share recovery.
- Announced planned acquisition of GOJO Industries to expand health and hygiene leadership, leveraging Clorox’s scale and margin management for long-term value creation.
- Q2 saw sequential improvement with category growth roughly flat and share down but improving; reaffirmed guidance of 0–1% category growth in H2 2026.
- Expect H2 gross margin expansion driven by higher cost savings, winding down of ERP-related costs (one-time $0.08 EPS impact in Q3), and a 50 bps benefit from Glad JV termination.
- Back half weighted to innovation: launches of Pure Allergen surface cleaners, Glad ForceFlex LeakGuard bags and a multi-year litter relaunch, with most shelf resets in late Q3/early Q4.
- Announced planned acquisition of GOJO Industries to expand Clorox’s leadership in health and hygiene.
- Digital transformation update: core ERP implementation completes by end of Q3 2026, after which transition costs cease and productivity gains will accelerate.
- Net sales fell 1% to $1.67 billion, with organic sales also down 1%, reflecting lower consumption partially offset by shipment timing.
- Gross margin declined 60 bps to 43.2% versus the prior year, primarily due to higher manufacturing and logistics costs.
- Diluted GAAP EPS was $1.29 (down 16%), while adjusted EPS decreased 10% to $1.39.
- Entered into a definitive agreement to acquire GOJO Industries, expanding its health and hygiene portfolio.
- Full-year FY2026 outlook maintained: net sales down 6–10%, adjusted EPS of $5.95–6.30 (a 23–18% decline).
- Q2 net sales decreased 1% to $1.67 billion, organic sales down 1%; gross margin declined 60 bps to 43.2%; diluted EPS was $1.29 (–16%), adjusted EPS $1.39 (–10%).
- Year-to-date net cash provided by operations was $404 million, up 1% year-over-year.
- Reaffirmed FY26 outlook: net sales expected down 6%–10%, organic sales down 5%–9%; diluted EPS $5.60–$5.95 and adjusted EPS $5.95–$6.30.
- Entered definitive agreement to acquire GOJO Industries (Purell), expanding its health and hygiene portfolio; expected to close before the end of FY26.
- Clorox agreed to acquire GOJO Industries, maker of Purell, for $2.25 billion in cash (net purchase price ~$1.92 billion after tax benefits).
- The transaction is expected to be growth-accretive, financed primarily with debt at implied adjusted-EBITDA multiples of 11.9x (or 9.1x including projected synergies).
- GOJO generates nearly $800 million in annual sales with mid-single-digit growth, sources over 80% of revenue through a B2B distributor network, and operates about 20 million dispensers.
- The deal supports Clorox’s IGNITE strategy, expands its health-and-hygiene portfolio, and is expected to close by the end of fiscal 2026, subject to regulatory approvals and customary conditions.
- Clorox has agreed to acquire Gojo Industries, maker of the Purell brand, for approximately $2.25 billion (net purchase price $1.92 billion after a $330 million tax benefit), funding the deal primarily with debt and targeting close by the end of FY 2026.
- Gojo adds ~$800 million in annual sales with a three-year CAGR of 5%; about 80% of revenue is generated through its refill-based B2B channel supported by roughly 20 million dispensers.
- The transaction strengthens Clorox’s health and hygiene portfolio by combining Gojo’s Purell leadership in skin hygiene with Clorox’s retail surface-cleaning brands, unlocking cross-selling and growth synergies in both B2B and retail channels.
- Clorox expects at least $50 million in run-rate cost synergies, EPS neutrality in year 1 and accretion in year 2, with net debt leverage rising to 3.6× at close and returning to ~2.5× by end of CY 2027.
- Clorox has agreed to acquire Gojo Industries, maker of the Purell brand, for approximately $2.25 billion, with a net purchase price of $1.92 billion after a $330 million tax benefit; the deal will be funded primarily with debt and is expected to close by the end of FY 2026, subject to customary approvals.
- The transaction values Gojo at an adjusted EBITDA multiple of 11.9× (net of tax benefit) and 9.1× on a synergized basis.
- Gojo generated nearly $800 million in annual sales with a three-year CAGR of 5%, and derives 80% of revenue from a refill-based B2B model supported by ~20 million dispensers.
- Clorox expects at least $50 million in run-rate cost synergies, with the acquisition being EPS neutral in year one and accretive in year two; net debt leverage will rise to ~3.6× at closing, targeting ~2.5× by end of calendar 2027.
Fintool News
In-depth analysis and coverage of CLOROX CO /DE/.


Quarterly earnings call transcripts for CLOROX CO /DE/.
Ask Fintool AI Agent
Get instant answers from SEC filings, earnings calls & more