Earnings summaries and quarterly performance for Synchrony Financial.
Executive leadership at Synchrony Financial.
Brian Doubles
President and Chief Executive Officer
Alberto Casellas
Executive Vice President and CEO—Health & Wellness
Amy Tiliakos
Senior Vice President, Chief Accounting Officer and Controller
Bart Schaller
Executive Vice President and CEO—Digital
Brian Wenzel
Executive Vice President, Chief Financial Officer
Carol Juel
Executive Vice President, Chief Technology and Operating Officer
Courtney Gentleman
Executive Vice President and CEO—Diversified & Value
Curtis Howse
Executive Vice President and CEO—Home & Auto
Darrell Owens
Executive Vice President and CEO—Lifestyle
Jonathan Mothner
Executive Vice President, Chief Risk and Legal Officer
Board of directors at Synchrony Financial.
Art Coviello
Director
Bill Parker
Director
Daniel Colao
Director
Deborah Ellinger
Director
Ellen Zane
Director
Fernando Aguirre
Director
Jeffrey Naylor
Non-Executive Chair of the Board
Kamila Chytil
Director
Laurel Richie
Director
Paget Alves
Director
Roy Guthrie
Director
Research analysts who have asked questions during Synchrony Financial earnings calls.
Mihir Bhatia
Bank of America
7 questions for SYF
Ryan Nash
Goldman Sachs & Co.
7 questions for SYF
Jeffrey Adelson
Morgan Stanley
6 questions for SYF
Moshe Orenbuch
TD Cowen
6 questions for SYF
Terry Ma
Barclays
6 questions for SYF
Robert Wildhack
Autonomous Research
5 questions for SYF
Erika Najarian
UBS
4 questions for SYF
John Hecht
Jefferies
4 questions for SYF
Sanjay Sakhrani
Keefe, Bruyette & Woods (KBW)
4 questions for SYF
Donald Fandetti
Wells Fargo & Company
3 questions for SYF
Don Fandetti
Wells Fargo
3 questions for SYF
John Pancari
Evercore ISI
3 questions for SYF
Mark DeVries
Deutsche Bank
3 questions for SYF
Richard Shane
JPMorgan Chase & Co.
3 questions for SYF
Brian Foran
Truist Financial
2 questions for SYF
Rick Shane
JPMorgan Chase & Co.
2 questions for SYF
Sanjay Sakrani
KBW
2 questions for SYF
Bill Carcache
Wolfe Research, LLC
1 question for SYF
Vernon Crowell
Robert W. Baird & Co.
1 question for SYF
Recent press releases and 8-K filings for SYF.
- On February 18, 2026, Synchrony Financial entered into an underwriting agreement with BofA Securities, J.P. Morgan Securities and Mizuho Securities to issue $750 million of 4.947% Fixed-to-Floating Rate Senior Notes due 2032.
- The notes will be issued under the Base Indenture dated August 11, 2014, as supplemented by the Twelfth Supplemental Indenture (August 2, 2024) and the Fifteenth Supplemental Indenture (February 25, 2026).
- The 8-K exhibits include the underwriting agreement (Exhibit 1.1) , the Fifteenth Supplemental Indenture (Exhibit 4.1) , and the legal opinion of Sidley Austin LLP (Exhibit 5.1).
- Integration of CareCredit as the preferred patient financing solution across all Planet DDS platforms, reaching 15,000+ Denticon and 2,500+ Cloud 9 practices
- Marks Synchrony’s first integration into an orthodontic-specific practice management system (Cloud 9), embedding financing workflows for orthodontic care
- Partnership streamlines financing with prequalification without credit score impact and payments to practices in as little as two business days
- Renewed multi-year agreement, originally launched in 2020, supports over 6 million patients in active orthodontic treatment nationwide
- Synchrony reports a K-shaped consumer recovery, with non-prime customers remaining stable and the prime (mid-tier) segment facing wage and affordability pressures.
- The newly launched Walmart OnePay program is one of the company’s most successful partnerships, featuring richer economics, seamless integration and prescreens totaling one of the largest in Q4 2025, with expected loss content below prior levels.
- For 2026, Synchrony targets mid-single digit receivables growth, expects net interest income and margin to expand year-over-year, and projects stable credit metrics, though it did not provide specific NII guidance.
- Key investments include expansion in health & wellness (CareCredit, Allegro), enhancements to customer experience, and AI/cloud initiatives to drive capacity, productivity and future agentic commerce capabilities.
- CFO Brian Wenzel highlighted stable consumer credit with non-prime resilience and pressure primarily on the prime-middle segment, driving portfolio mix shifts toward superprime.
- Synchrony expects mid-single-digit receivables growth in 2026 and projects net interest income and margin expansion supported by prior rate repricing actions, despite growth-related headwinds.
- The Walmart OnePay launch is deemed one of the company’s most successful, with enhanced value propositions and advanced tech integration; upcoming partnerships include Lowe’s and two additional programs in H2 2026.
- The firm will continue strategic investments in health & wellness financing, customer experience enhancements, and AI & cloud capabilities to drive medium- and long-term growth.
- Synchrony plans aggressive yet prudent share buybacks, supported by strong capital generation and a 250 bp Stress Capital Buffer, aiming to return value to shareholders.
- CFO Brian Wenzel noted a K-shaped recovery: non-prime consumers remain stable, prime borrowers face affordability pressure, and the superprime segment has grown by 700 bps, carrying a 31% payment rate.
- The newly relaunched Walmart OnePay is the most successful program in company history, featuring a richer value proposition tied to Walmart+, seamless tech integration, and an expected loss rate well below the prior ~10% loss content.
- Synchrony projects mid-single-digit receivables growth in 2026, with net interest income set to increase, while 90+ day delinquencies outperformed seasonality by 7 bps and loss rates remained below 5%.
- Key 2026 investments focus on expanding health & wellness offerings (CareCredit dual card, Allegro installment), enhancing the customer experience, and advancing AI/cloud initiatives to boost capacity, productivity and prepare for agentic commerce.
- Q4 purchase volume rose 3% YoY to $49.5 bn, driven by Dual Card/Co-Brand growth of 16%.
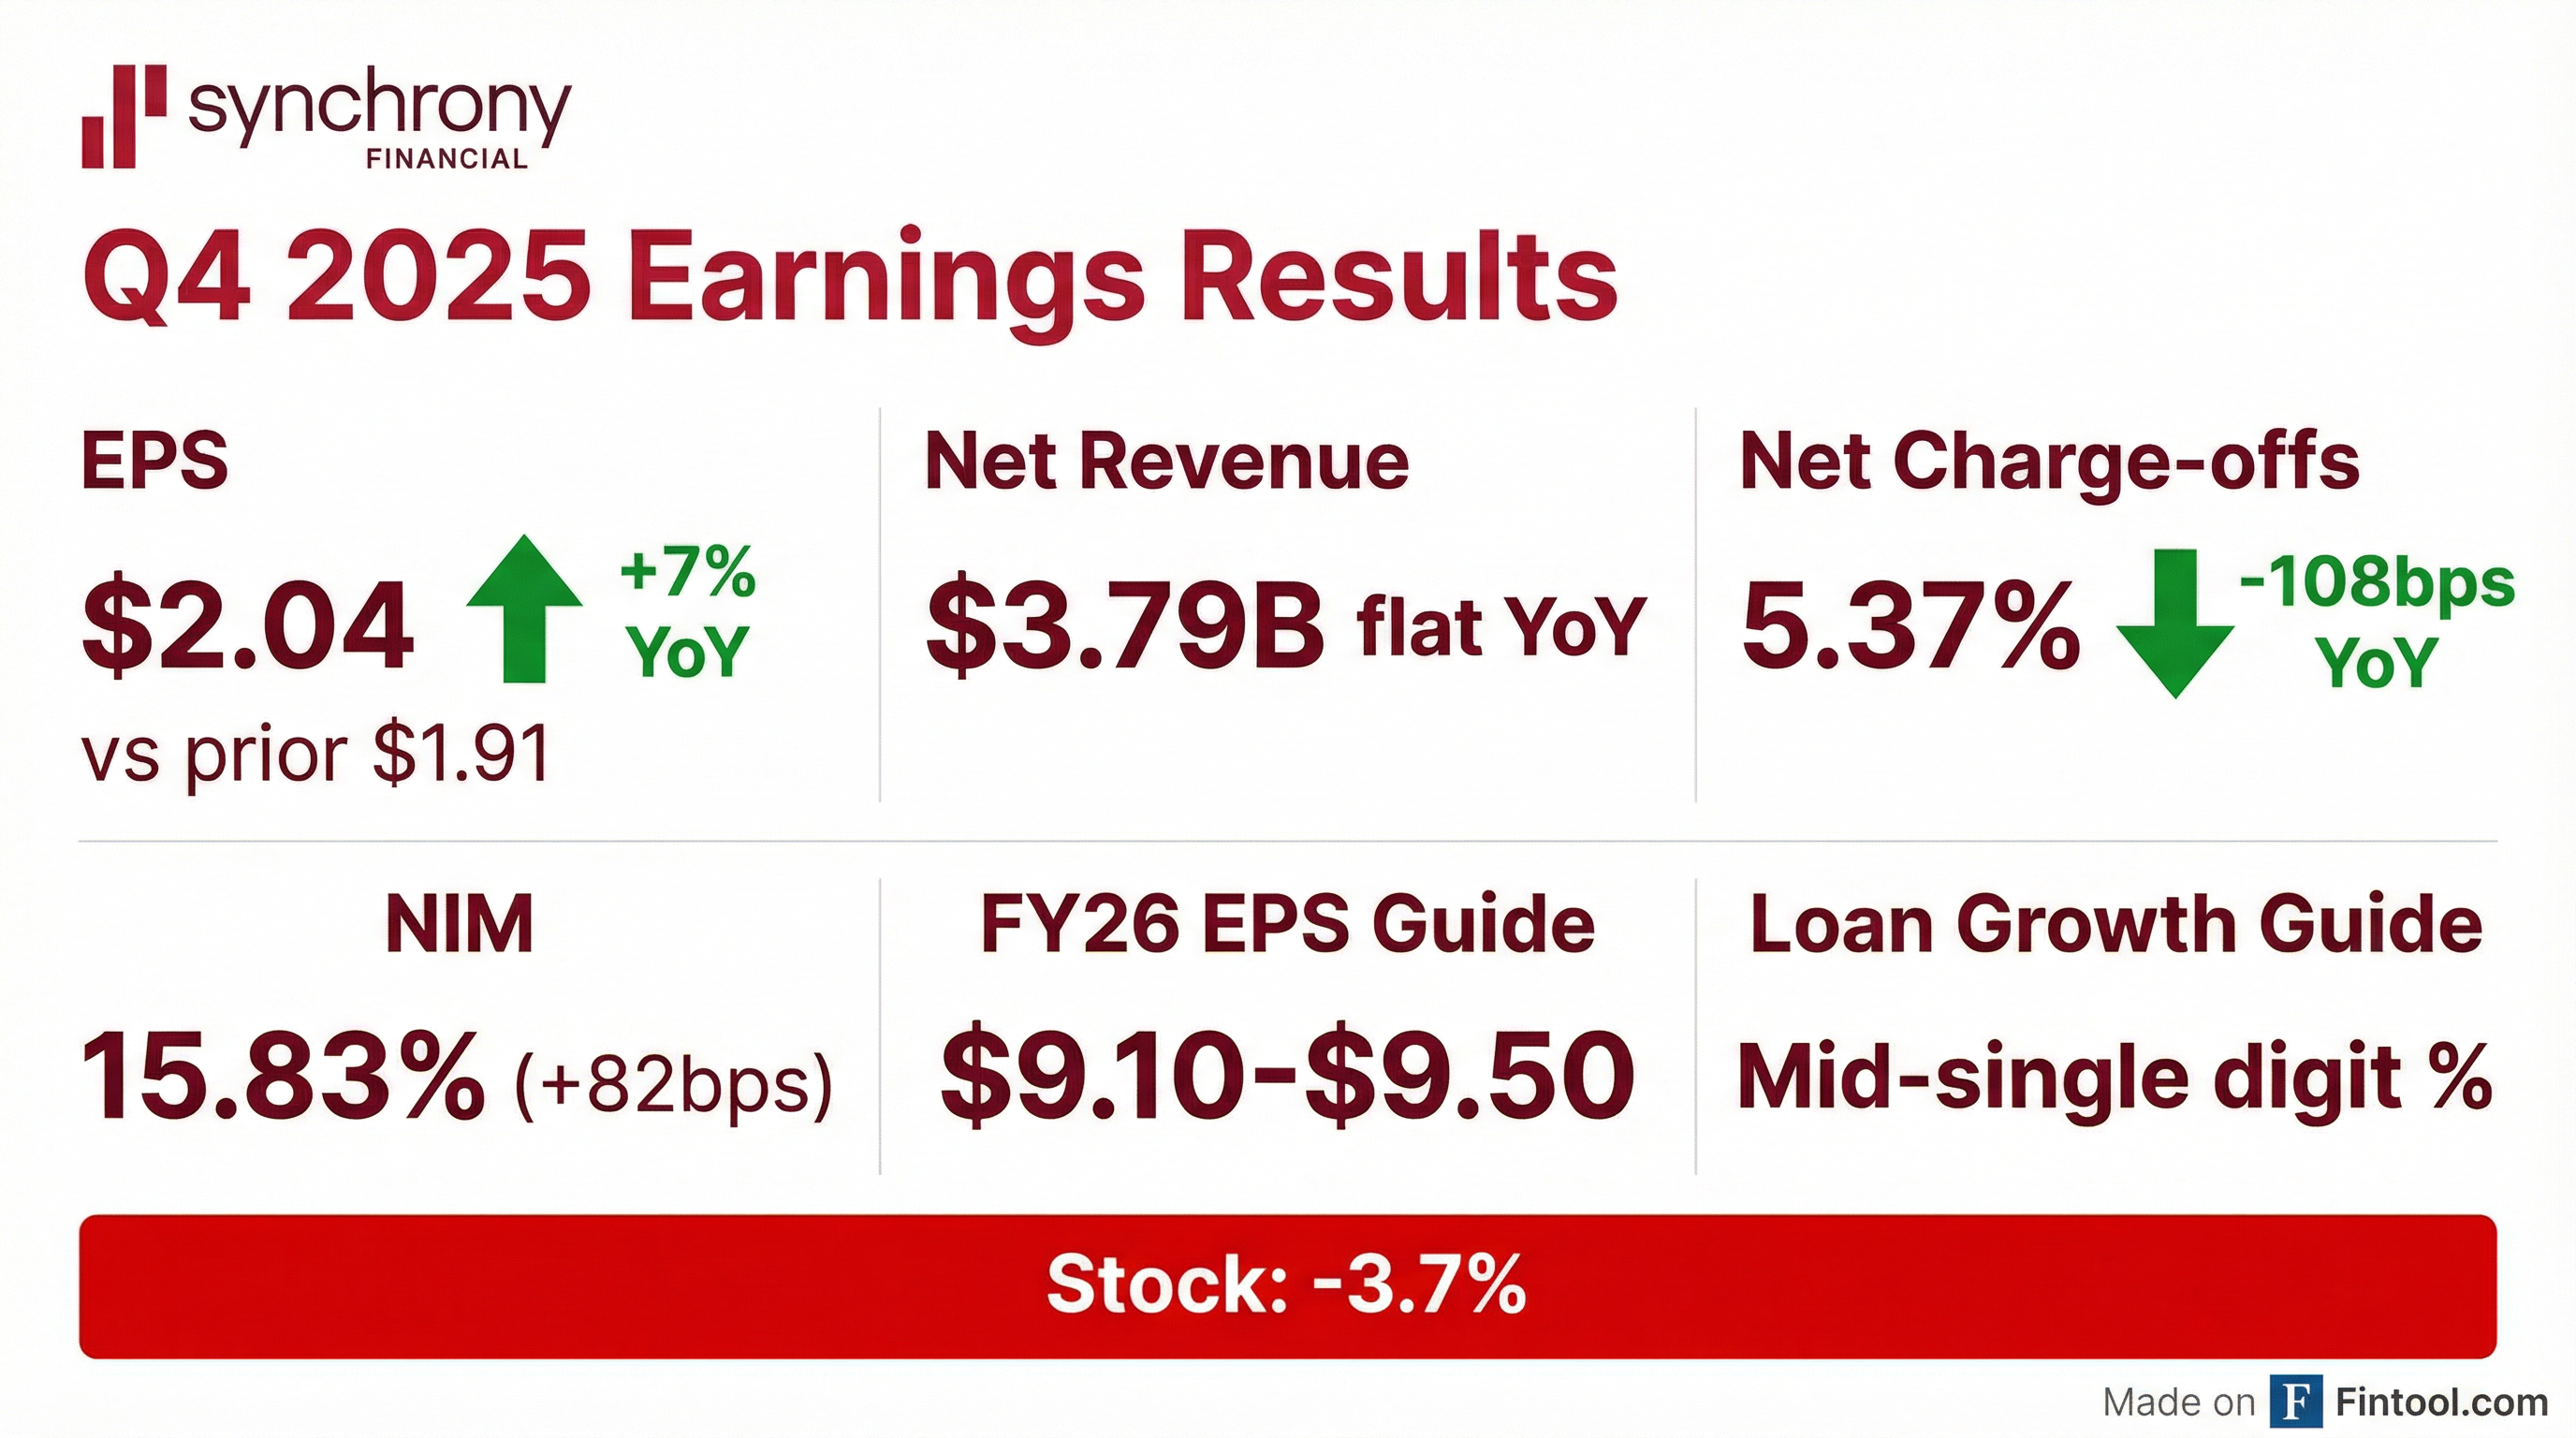
- Net revenue was $3.793 bn, essentially flat YoY; net interest margin widened 82 bps to 15.83% on higher loan yields and lower funding costs.
- Net earnings were $751 mm, or $2.04 diluted EPS (up 7% YoY, includes ~$0.14 restructuring charge); net charge-off rate improved to 5.37% from 6.45% a year ago.
- Provision for credit losses declined 8% to $1.442 bn, while 30+ days past due improved to 4.39% of period-end receivables.
- Returned $1.1 bn of capital in the quarter; CET1 capital ratio was 12.6%.
- Synchrony generated Q4 net earnings of $751 million (**$2.04** per diluted share), with a 2.5% return on average assets and 21.8% return on tangible common equity.
- Fourth-quarter purchase volume reached a record $49 billion (up 3% YoY); for full year 2025, Synchrony added 20 million new accounts and facilitated $182 billion of partner sales.
- Credit performance strengthened: net charge-off rate fell to 5.37% (down 108 bps YoY) and 30+/90+ delinquency rates remained below pre-pandemic levels .
- Balance sheet and funding: ending loan receivables of $104 billion (-1% QoQ), CET1 ratio of 12.6%, and issued a $750 million, 3-year secured bond at 4.06% .
- 2026 guidance includes mid-single-digit receivables growth, net charge-offs in the 5.5%–6% range, net interest income growth and EPS of $9.10–$9.50 .
- Synchrony reported Q4 net earnings of $751 million or $2.04 per diluted share, with full-year net earnings of $3.6 billion or $9.28 per share; Q4 return on average assets was 2.5% and return on tangible common equity was 21.8%, while full-year ROA was 3.0% and ROTCE was 25.8%.
- Q4 purchase volume reached a record $49 billion, up 3% year-over-year, as average active accounts and spend trends strengthened across most platforms.
- The company returned $1.1 billion to shareholders in Q4 through $952 million of share repurchases and $106 million of dividends, bringing full-year capital returns to $3.3 billion.
- For 2026, Synchrony forecasts mid-single-digit receivables growth, a net charge-off rate within its 5.5%–6% target range, and EPS of $9.10 to $9.50.
- Net earnings of $751 million (Q4) or $2.04 per diluted share and $3.6 billion (FY) or $9.28 per diluted share; return on average assets 2.5% and return on tangible common equity 21.8%; tangible book value per share up 9% YoY.
- Q4 purchase volume of $49 billion, a record and +3% YoY; ending loan receivables down 1% to $104 billion; net interest income +4% to $4.8 billion; net interest margin +82 bps to 15.83%.
- Asset quality strengthened: 30+ delinquency at 4.49% (–21 bps), 90+ delinquency at 2.17% (–23 bps), and net charge-off rate at 5.37% (–108 bps); allowance for credit losses 10.06% of receivables.
- Funding and capital robust: deposits 84% of total funding; CET1 ratio 12.6%, Tier 1 ratio 13.8%, total capital ratio 15.8%; returned $1.1 billion to shareholders in Q4 (repurchases $952 million, dividends $106 million).
- 2026 outlook calls for mid-single-digit ending receivables growth, net charge-off rate of 5.5%–6%, growing net interest income, and EPS of $9.10–$9.50 for the year.
- Synchrony posted net earnings of $751 million ($2.04 per diluted share) in Q4 2025, down from $774 million ($1.91) in Q4 2024, including a $51 million after-tax restructuring charge ($0.14 EPS)
- Purchase volume rose 3% to $49.5 billion, while loan receivables declined 1% to $103.8 billion, reflecting a $0.2 billion sale of receivables in the quarter
- Net interest margin expanded 82 basis points to 15.83%, though the efficiency ratio widened 360 bps to 36.9% largely due to restructuring costs
- Returns dipped modestly, with ROA at 2.5% (-10 bps) and ROE at 17.6% (-130 bps), while book value per share climbed 13% to $44.74
Quarterly earnings call transcripts for Synchrony Financial.
Ask Fintool AI Agent
Get instant answers from SEC filings, earnings calls & more