Earnings summaries and quarterly performance for TRACTOR SUPPLY CO /DE/.
Executive leadership at TRACTOR SUPPLY CO /DE/.
Harry A. Lawton III
President and Chief Executive Officer
J. Seth Estep
Executive Vice President - Chief Merchandising Officer
John P. Ordus
Executive Vice President - Chief Stores Officer
Kurt D. Barton
Executive Vice President - Chief Financial Officer and Treasurer
Robert D. Mills
Executive Vice President - Chief Technology, Digital Commerce, and Strategy Officer
Board of directors at TRACTOR SUPPLY CO /DE/.
Research analysts who have asked questions during TRACTOR SUPPLY CO /DE/ earnings calls.
Michael Lasser
UBS
9 questions for TSCO
Peter Benedict
Robert W. Baird & Co.
9 questions for TSCO
Christopher Horvers
JPMorgan Chase & Co.
8 questions for TSCO
Steven Forbes
Guggenheim Securities, LLC
7 questions for TSCO
David Bellinger
Mizuho Securities USA LLC
6 questions for TSCO
Peter Keith
Piper Sandler & Co.
6 questions for TSCO
Scot Ciccarelli
Truist Securities
6 questions for TSCO
Robert Ohmes
Bank of America
5 questions for TSCO
Steven Zaccone
Citigroup
5 questions for TSCO
Zachary Fadem
Wells Fargo
5 questions for TSCO
Chuck Grom
Gordon Haskett Research Advisors
4 questions for TSCO
Karen Short
Melius Research
4 questions for TSCO
Kate McShane
Goldman Sachs
4 questions for TSCO
Seth Sigman
Cantor Fitzgerald
3 questions for TSCO
Bobby Griffin
Raymond James Financial
2 questions for TSCO
Charles Grom
Gordon Haskett Research Advisors
2 questions for TSCO
Jonathan Matuszewski
Jefferies Financial Group Inc.
2 questions for TSCO
Michael Baker
D.A. Davidson & Co.
2 questions for TSCO
Oliver Wintermantel
Evercore ISI
2 questions for TSCO
Simeon Gutman
Morgan Stanley
2 questions for TSCO
Spencer Hanus
Wolfe Research
2 questions for TSCO
Barath Ratta
JPMorgan Chase & Co.
1 question for TSCO
Charles Cerankosky
Northcoast Research
1 question for TSCO
Chuck Cerankosky
Northcoast Research
1 question for TSCO
Josh Young
Truist Securities
1 question for TSCO
Katharine McShane
Goldman Sachs Group, Inc.
1 question for TSCO
Zach Fadem
Wells Fargo
1 question for TSCO
Recent press releases and 8-K filings for TSCO.
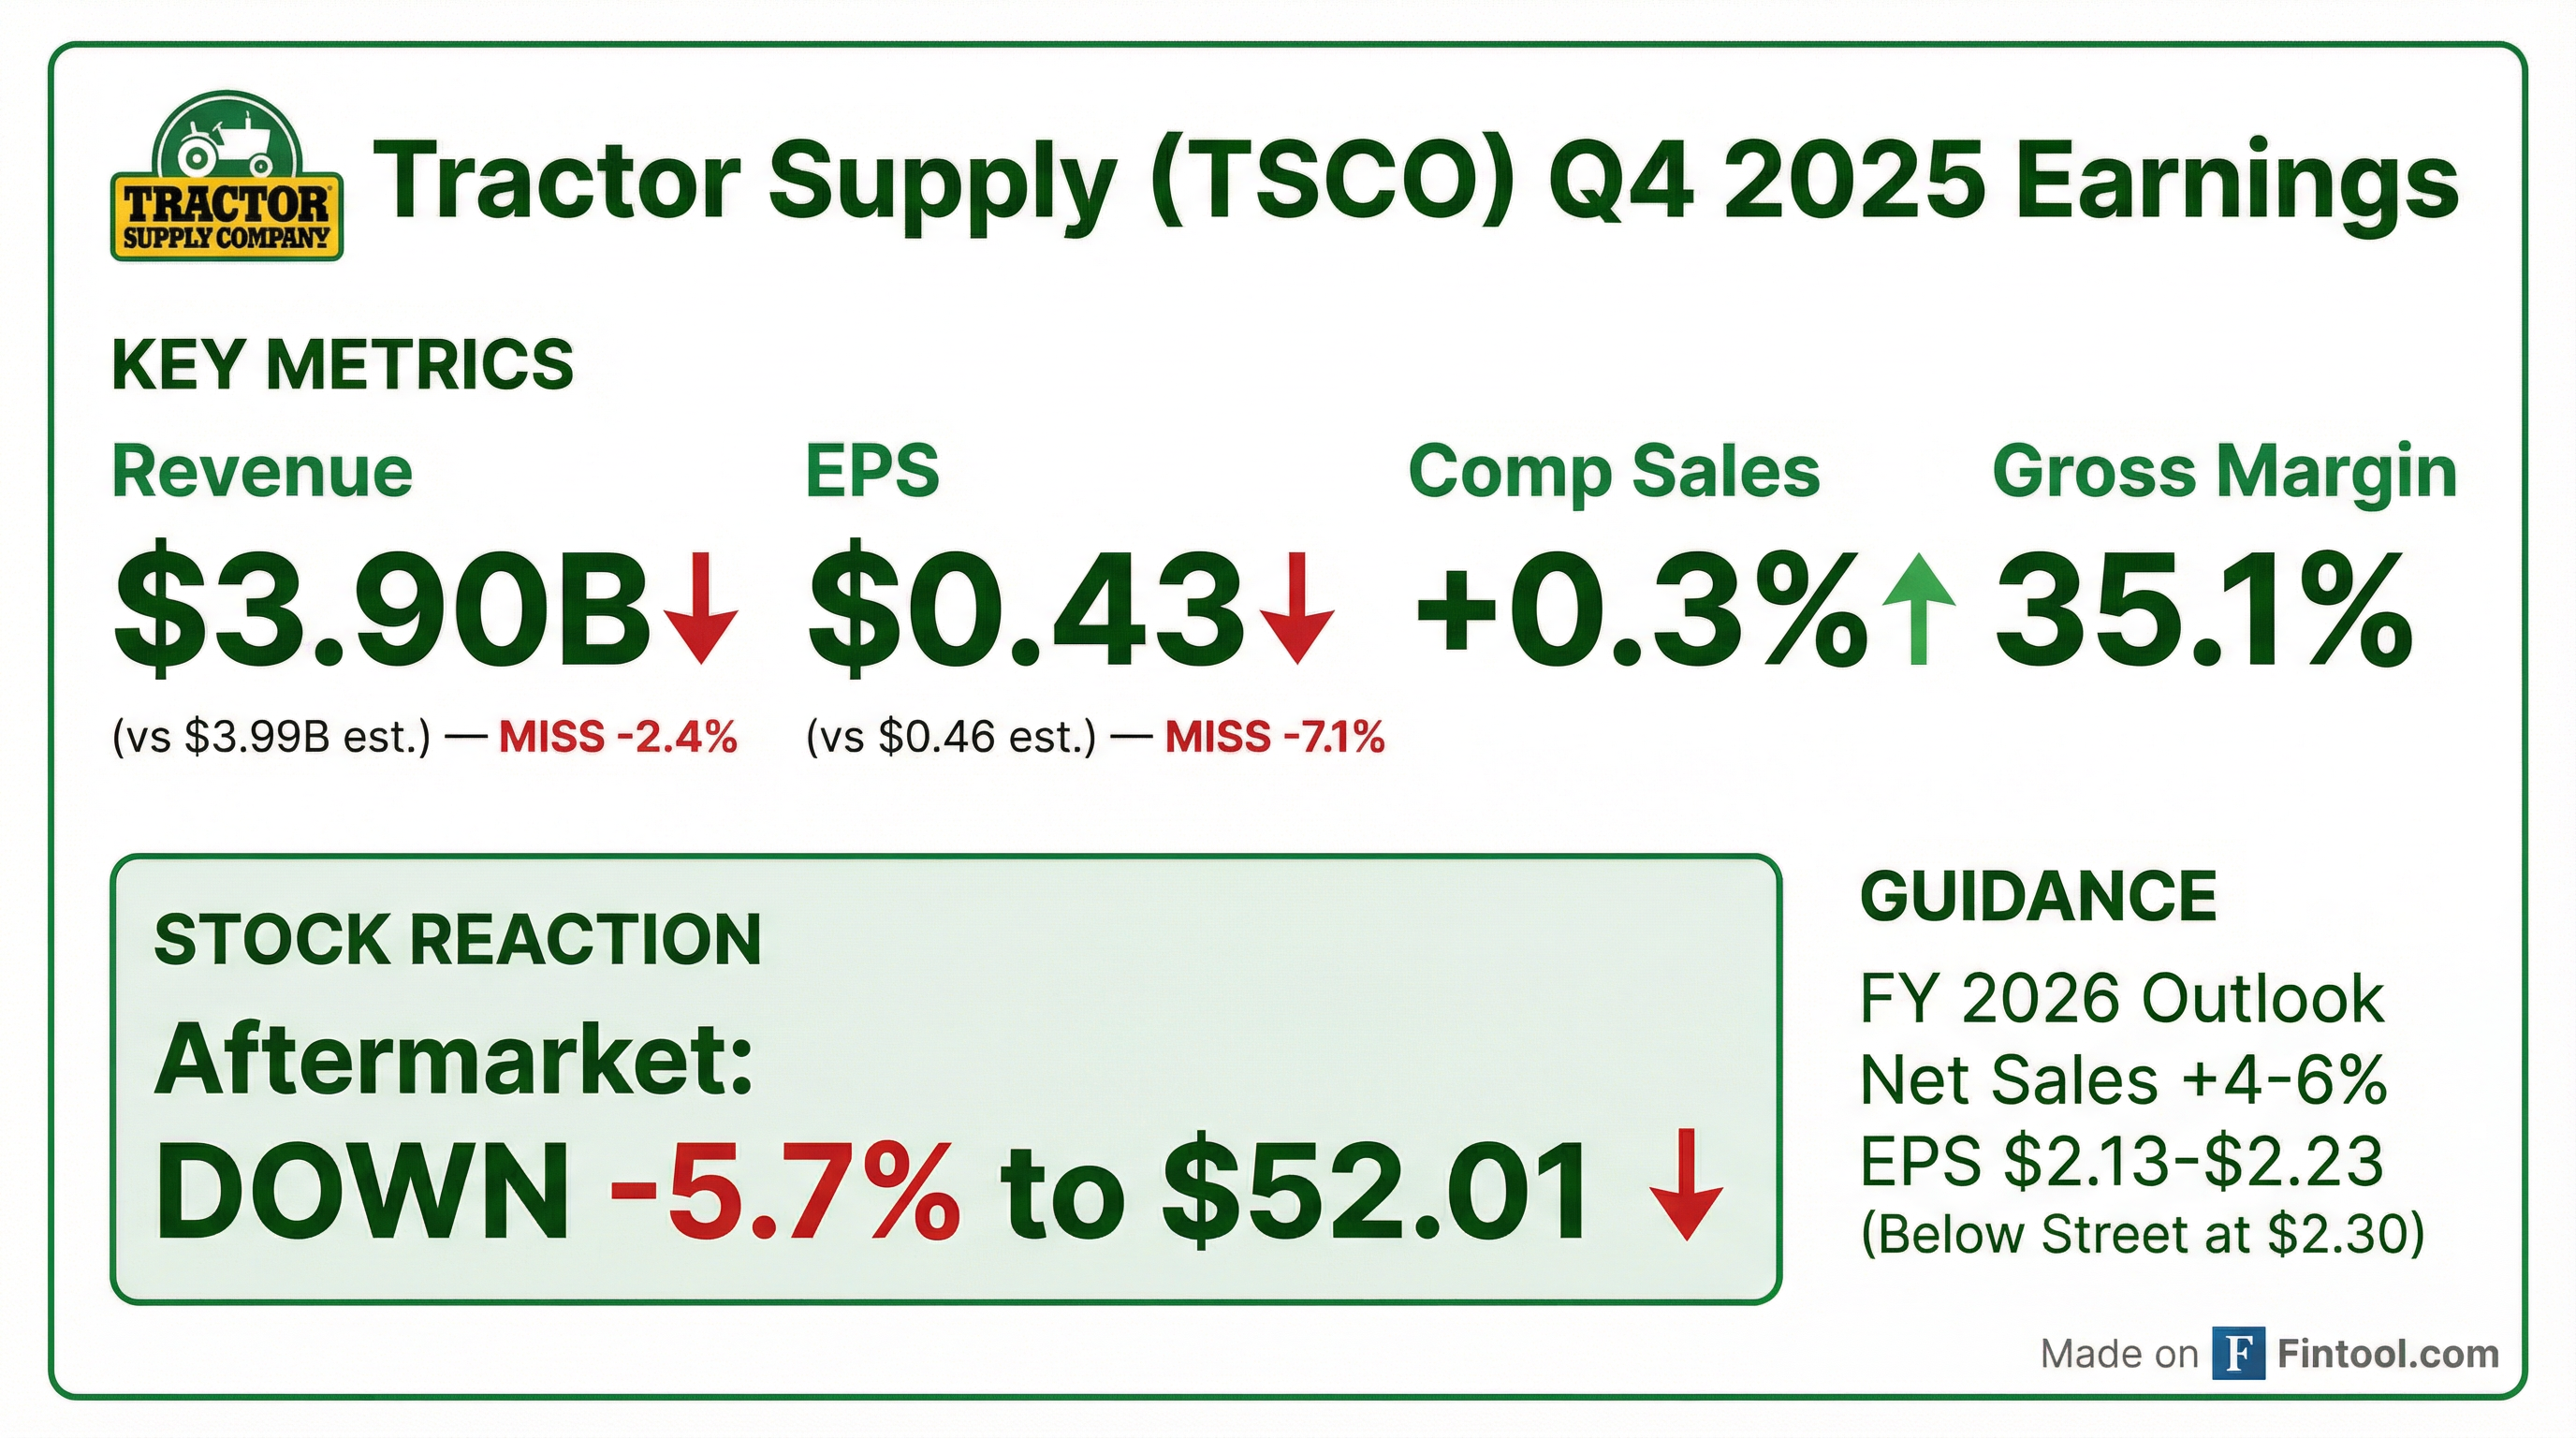
- Net sales were $3.90 billion, up from $3.77 billion in Q4 2024, with comparable store sales of +0.3% in Q4 2025.
- Operating margin declined to 7.6% of net sales, while net income amounted to $227.4 million and diluted EPS was $0.43.
- Gross margin was 35.1% of net sales and SG&A expenses increased to 27.5%, driven by higher promotional and delivery costs as well as planned investments.
- The company opened 99 new Tractor Supply stores and 5 Petsense stores in 2025, and achieved high single-digit digital sales growth.
- For fiscal 2026, Tractor Supply guides to net sales growth of +4% to +6% and diluted EPS of $2.13 to $2.23.
- Net sales rose 3.3% to $3.9 billion in Q4, with comparable store sales up 0.3%; diluted EPS was $0.43.
- For FY 2025, net sales increased 4.3% to $15.5 billion with comparable comps of 1.2%; diluted EPS was $2.06.
- Q4 gross margin contracted by 10 bps amid elevated promotions and tariffs; SG&A increased to 27.5% of sales, and the effective tax rate improved to 19%.
- 2026 outlook: 4–6% total sales growth, 1–3% comp growth, 9.3–9.6% operating margin, EPS of $2.13–$2.23, $675–725 million capex, 100 new stores, and $375–450 million in share repurchases.
- Strategic initiatives include doubling direct-sales specialists to target $50 million in sales and expanding final-mile delivery to ~375 hubs covering 50% of stores.
- Q4 net sales rose 3.3% to $3.9 billion, with comps up 0.3% and diluted EPS of $0.43; digital sales grew high-single digits.
- Full-year 2025 net sales increased 4.3% to $15.5 billion, comps gained 1.2%, and diluted EPS was $2.06; digital business also delivered high-single-digit growth.
- Q4 performance was held back by cycling last year’s storm benefits (≈100 bps headwind), softer big-ticket and holiday categories amid elevated promotions, while consumable and farm/ranch products gained share.
- 2026 outlook: net sales growth of 4–6%, comps 1–3%, operating margin 9.3–9.6%, diluted EPS $2.13–2.23; plans include ~100 new stores, $675–725 million capex, and $375–450 million in share repurchases.
- Q4 2025 net sales rose 3.3% to $3.9 billion, with comparable store sales up 0.3%, diluted EPS of $0.43, and digital sales delivering high single-digit growth.
- FY 2025 net sales increased 4.3% to $15.5 billion, comparable store sales +1.2%, diluted EPS of $2.06, with Neighbors Club contributing over 80% of sales.
- Q4 gross margin declined ~10 bps; SG&A rose ~70 bps to 27.5% of sales; operating income fell 6.5%; effective tax rate improved to 19%.
- The quarter faced a ~100 bp comp headwind from absent storm recovery and high-single-digit declines in big-ticket and emergency response categories.
- 2026 outlook: total sales growth of 4–6%, comps 1–3%, diluted EPS $2.13–$2.23, operating margin 9.3–9.6%, net capex $675–725 million, 100 new stores, and $375–450 million in share repurchases.
- Recorded $3.90 billion in Q4 2025 net sales (+3.3% YOY) and diluted EPS of $0.43 (vs. $0.44 prior year).
- Delivered FY 2025 net sales of $15.52 billion (+4.3% YOY) and diluted EPS of $2.06.
- Comparable store sales rose 0.3% in Q4 and 1.2% for the full year.
- Issued FY 2026 guidance for net sales growth of 4%–6% and diluted EPS of $2.13–$2.23.
- Returned capital of $238.9 million in Q4 via $117.5 million of buybacks and $121.4 million of dividends; FY 2025 total return was $848.5 million.
- In Q4 2025, net sales rose 3.3% to $3.90 billion with comparable-store sales up 0.3%, and diluted EPS was $0.43.
- For FY 2025, net sales increased 4.3% to $15.52 billion with comparable-store sales growth of 1.2%, and diluted EPS was $2.06.
- The company forecasts FY 2026 net-sales growth of 4%–6% and diluted EPS of $2.13–$2.23.
- In Q4 2025, Tractor Supply repurchased 2.2 million shares for $117.5 million and paid $121.4 million in dividends; for FY 2025, it repurchased 6.6 million shares for $360.8 million and paid $487.7 million in dividends.
- Tractor Supply opened its 2,400th store in Aiken, South Carolina, in early January 2026.
- The Aiken launch is one of four grand openings in the first two weeks of 2026, supporting a plan to open 100 new stores by year-end.
- The new store features a 3,000 sq ft Garden Center and complements a nearby location that has served the community since 2004.
- Tractor Supply donated $2,400 to Aiken Equine Rescue as part of the grand opening celebrations.
- The consumer remains healthy and resilient, with positive comparable store transactions, mid-single-digit CUE comps, strong big-ticket gains and stable discretionary categories in H1 2025.
- Tariff-related costs are now flowing into P&L in H2, prompting modest 1–2% price increases with no notable elasticity impact so far.
- Gross margin improved 30 bps in H1 2025; management expects an additional 5–15 bps expansion in H2, moderating headwinds from lapping distribution center benefits, consumable mix and tariffs.
- The company is pursuing four “Life Out Here” growth pillars: Allivet pet pharmacy acquisition integration, B2B direct sales, final-mile delivery rollout and 15% store localization.
- Tractor Supply plans 90+ store openings in 2025 (ramping to 100 in 2026), including 18 Big Lots retrofits, while managing limited cannibalization and exceeding new-store ROI forecasts.
- Tractor Supply grew net sales 4.5% to $4.44 B with comparable store sales up 1.5% (transactions +1%, ticket +0.5%), delivering diluted EPS of $0.81 in Q2 2025.
- Gross margin expanded 31 bps to 36.9%, operating income rose 2.9% to $577.8 M, and net income increased 1.1% to $430 M; inventories ended at $3.1 B to bolster in-stock levels.
- Returned $196 M to shareholders via dividends and buybacks; full-year repurchase guidance lowered to $325–375 M (from $525–600 M) to support inventory and tariff impacts.
- Reconfirmed 2025 outlook: net sales growth 4–8%, comp store sales flat to +4%, operating margin 9.5–9.9%, net income $1.07–1.17 B (EPS $2.00–2.18).
- Store and Revenue Growth: Tractor Supply Co operates over 2,300 stores and expects revenue to exceed $15 billion, having doubled revenues over the last five years.
- Strategic Expansion: The company highlighted its Life Out Here 2030 strategy, aiming to drive new store growth (targeting around 90 new stores this year with a goal of 100 annually) and boost comparable sales through initiatives like direct sales and final mile delivery.
- Enhanced Service Offerings: Through the acquisition of Alivet, Tractor Supply is integrating pet Rx services—part of a broader effort to monetize its extensive customer base, which includes over 40 million Neighbor's Club members.
- Market Position and Pricing Resilience: The company benefits from a strong rural consumer base, limited tariff impact (with over 60% of products made in the U.S.), and a balanced mix of commodity and big-ticket sales.
Quarterly earnings call transcripts for TRACTOR SUPPLY CO /DE/.
Ask Fintool AI Agent
Get instant answers from SEC filings, earnings calls & more