Earnings summaries and quarterly performance for PEPSICO.
Executive leadership at PEPSICO.
Ramon Laguarta
Chairman and Chief Executive Officer
David Flavell
Executive Vice President, General Counsel and Corporate Secretary
Rebecca Schmitt
Executive Vice President and Chief People Officer
Silviu Popovici
Chief Executive Officer, Europe, Middle East and Africa
Stephen Schmitt
Executive Vice President and Chief Financial Officer
Steven Williams
Chief Executive Officer, North America
Board of directors at PEPSICO.
Alberto Weisser
Director
Cesar Conde
Director
Daniel Vasella
Director
David Page
Director
Dina Dublon
Director
Edith Cooper
Director
Ian Cook
Presiding Director
Jennifer Bailey
Director
Michelle Gass
Director
Robert Pohlad
Director
Segun Agbaje
Director
Sir Dave Lewis
Director
Susan Diamond
Director
Research analysts who have asked questions during PEPSICO earnings calls.
Dara Mohsenian
Morgan Stanley
8 questions for PEP
Filippo Falorni
Citigroup Inc.
8 questions for PEP
Kaumil Gajrawala
Jefferies
8 questions for PEP
Lauren Lieberman
Barclays
8 questions for PEP
Peter Grom
UBS Group
8 questions for PEP
Andrea Teixeira
JPMorgan Chase & Co.
7 questions for PEP
Bonnie Herzog
Goldman Sachs
7 questions for PEP
Michael Lavery
Piper Sandler & Co.
7 questions for PEP
Robert Moskow
TD Cowen
7 questions for PEP
Robert Ottenstein
Evercore ISI
7 questions for PEP
Kevin Grundy
BNP Paribas
6 questions for PEP
Peter Galbo
Bank of America
5 questions for PEP
Steve Powers
Deutsche Bank
5 questions for PEP
Chris Carey
Wells Fargo Securities
4 questions for PEP
Christopher Carey
Wells Fargo & Company
4 questions for PEP
Bryan Spillane
Bank of America
3 questions for PEP
Stephen Robert Powers
Deutsche Bank
2 questions for PEP
Charlie Higgs
Redburn Atlantic
1 question for PEP
Drew Levine
JPMorgan Chase & Co.
1 question for PEP
Gregory Melich
Evercore ISI
1 question for PEP
Stephen Powers
Deutsche Bank
1 question for PEP
Recent press releases and 8-K filings for PEP.
- PepsiCo will cut suggested retail prices on popular snacks—Lay’s, Doritos, Cheetos and Tostitos—by up to 15%, including roughly 14% off an 8-oz bag of Lay’s and an $0.80 cut on a 9.25-oz bag of Doritos, starting this week ahead of Super Bowl shopping.
- Price reductions are described as “selective and surgical”, focusing on products where price is the biggest barrier; actual in-store prices may vary by retailer.
- The move forms part of measures under an agreement with activist investor Elliott Investment Management, under which PepsiCo has agreed to cut its North American product lineup by about 20%.
- Alongside the price cuts, PepsiCo reported stronger-than-expected Q4 results, noting a 1% decline in North American food volumes and saw its stock rise 5% on the announcement.
- Affordability initiatives in Frito-Lay North America to drive volume, sales, and op margins early in 2026, funded by productivity gains; expecting double-digit shelf-space gains at resets.
- 2026 guidance sees organic sales strengthening in H2, with balanced first-half and second-half EPS; international mid-single-digit growth and acceleration from North America foods and beverages.
- Restaging of core brands (Lay’s, Tostitos, Gatorade, Quaker) and targeted perimeter innovations (e.g., Naked, protein, fiber) to simplify ingredients and capture new consumer segments.
- Anticipates broader GLP-1 adoption; focusing on portion control, hydration (Gatorade, Propel), fiber and protein innovations to meet evolving consumer needs.
- Piloting integrated food and beverage distribution in Texas and Florida, showing initial cost-efficiency and service benefits; further roll-out plans by year-end.
- Frito-Lay will grow volume, net revenue and operating margin in 2026, funded by productivity gains to accelerate affordability initiatives, with average shelf space gains in resets running in double digits.
- Company-wide sales are expected to strengthen in 2H 2026, with EPS growth balanced between first and second halves, and organic growth boosted by integrations of Poppi, Siete and Alani Nu.
- Health-focused innovation and portion control (single-serve, fiber, protein) are key to address broader GLP-1 adoption, preserving category relevance through smaller packs and functional beverages.
- Beverage margins to continue improving, leveraging the energy segment via Celsius and Alani Nu partnerships with growing distribution and brand-building investments.
- Guidance assumes a stretched low-income US consumer, mid-single digit growth in international markets (notably Mexico, China, Middle East) and caution in Western Europe, forming the basis for the 2026 outlook.
- Frito-Lay unit forecast: expects PFMA volume, net revenue and operating margin expansion in 2026, driven by targeted affordability investments funded by productivity gains and anticipated double-digit shelf-space gains in retail resets starting March/April.
- Organic sales guidance: projects international segment to grow mid-single digits (19-quarter trend), with further acceleration in North America beverages and foods in H2 2026; EPS to be balanced between H1 and H2.
- Brand innovation: major relaunches of Lay’s, Tostitos, Gatorade and Quaker featuring simpler ingredients and enhanced functionality, alongside peripheral launches (e.g., Naked, Pepsi prebiotics) to attract younger consumers.
- GLP-1 response: plans to address rising adoption of weight-loss drugs via portion-controlled formats, expanded hydration (Gatorade, Propel), fiber and protein offerings to maintain category relevance.
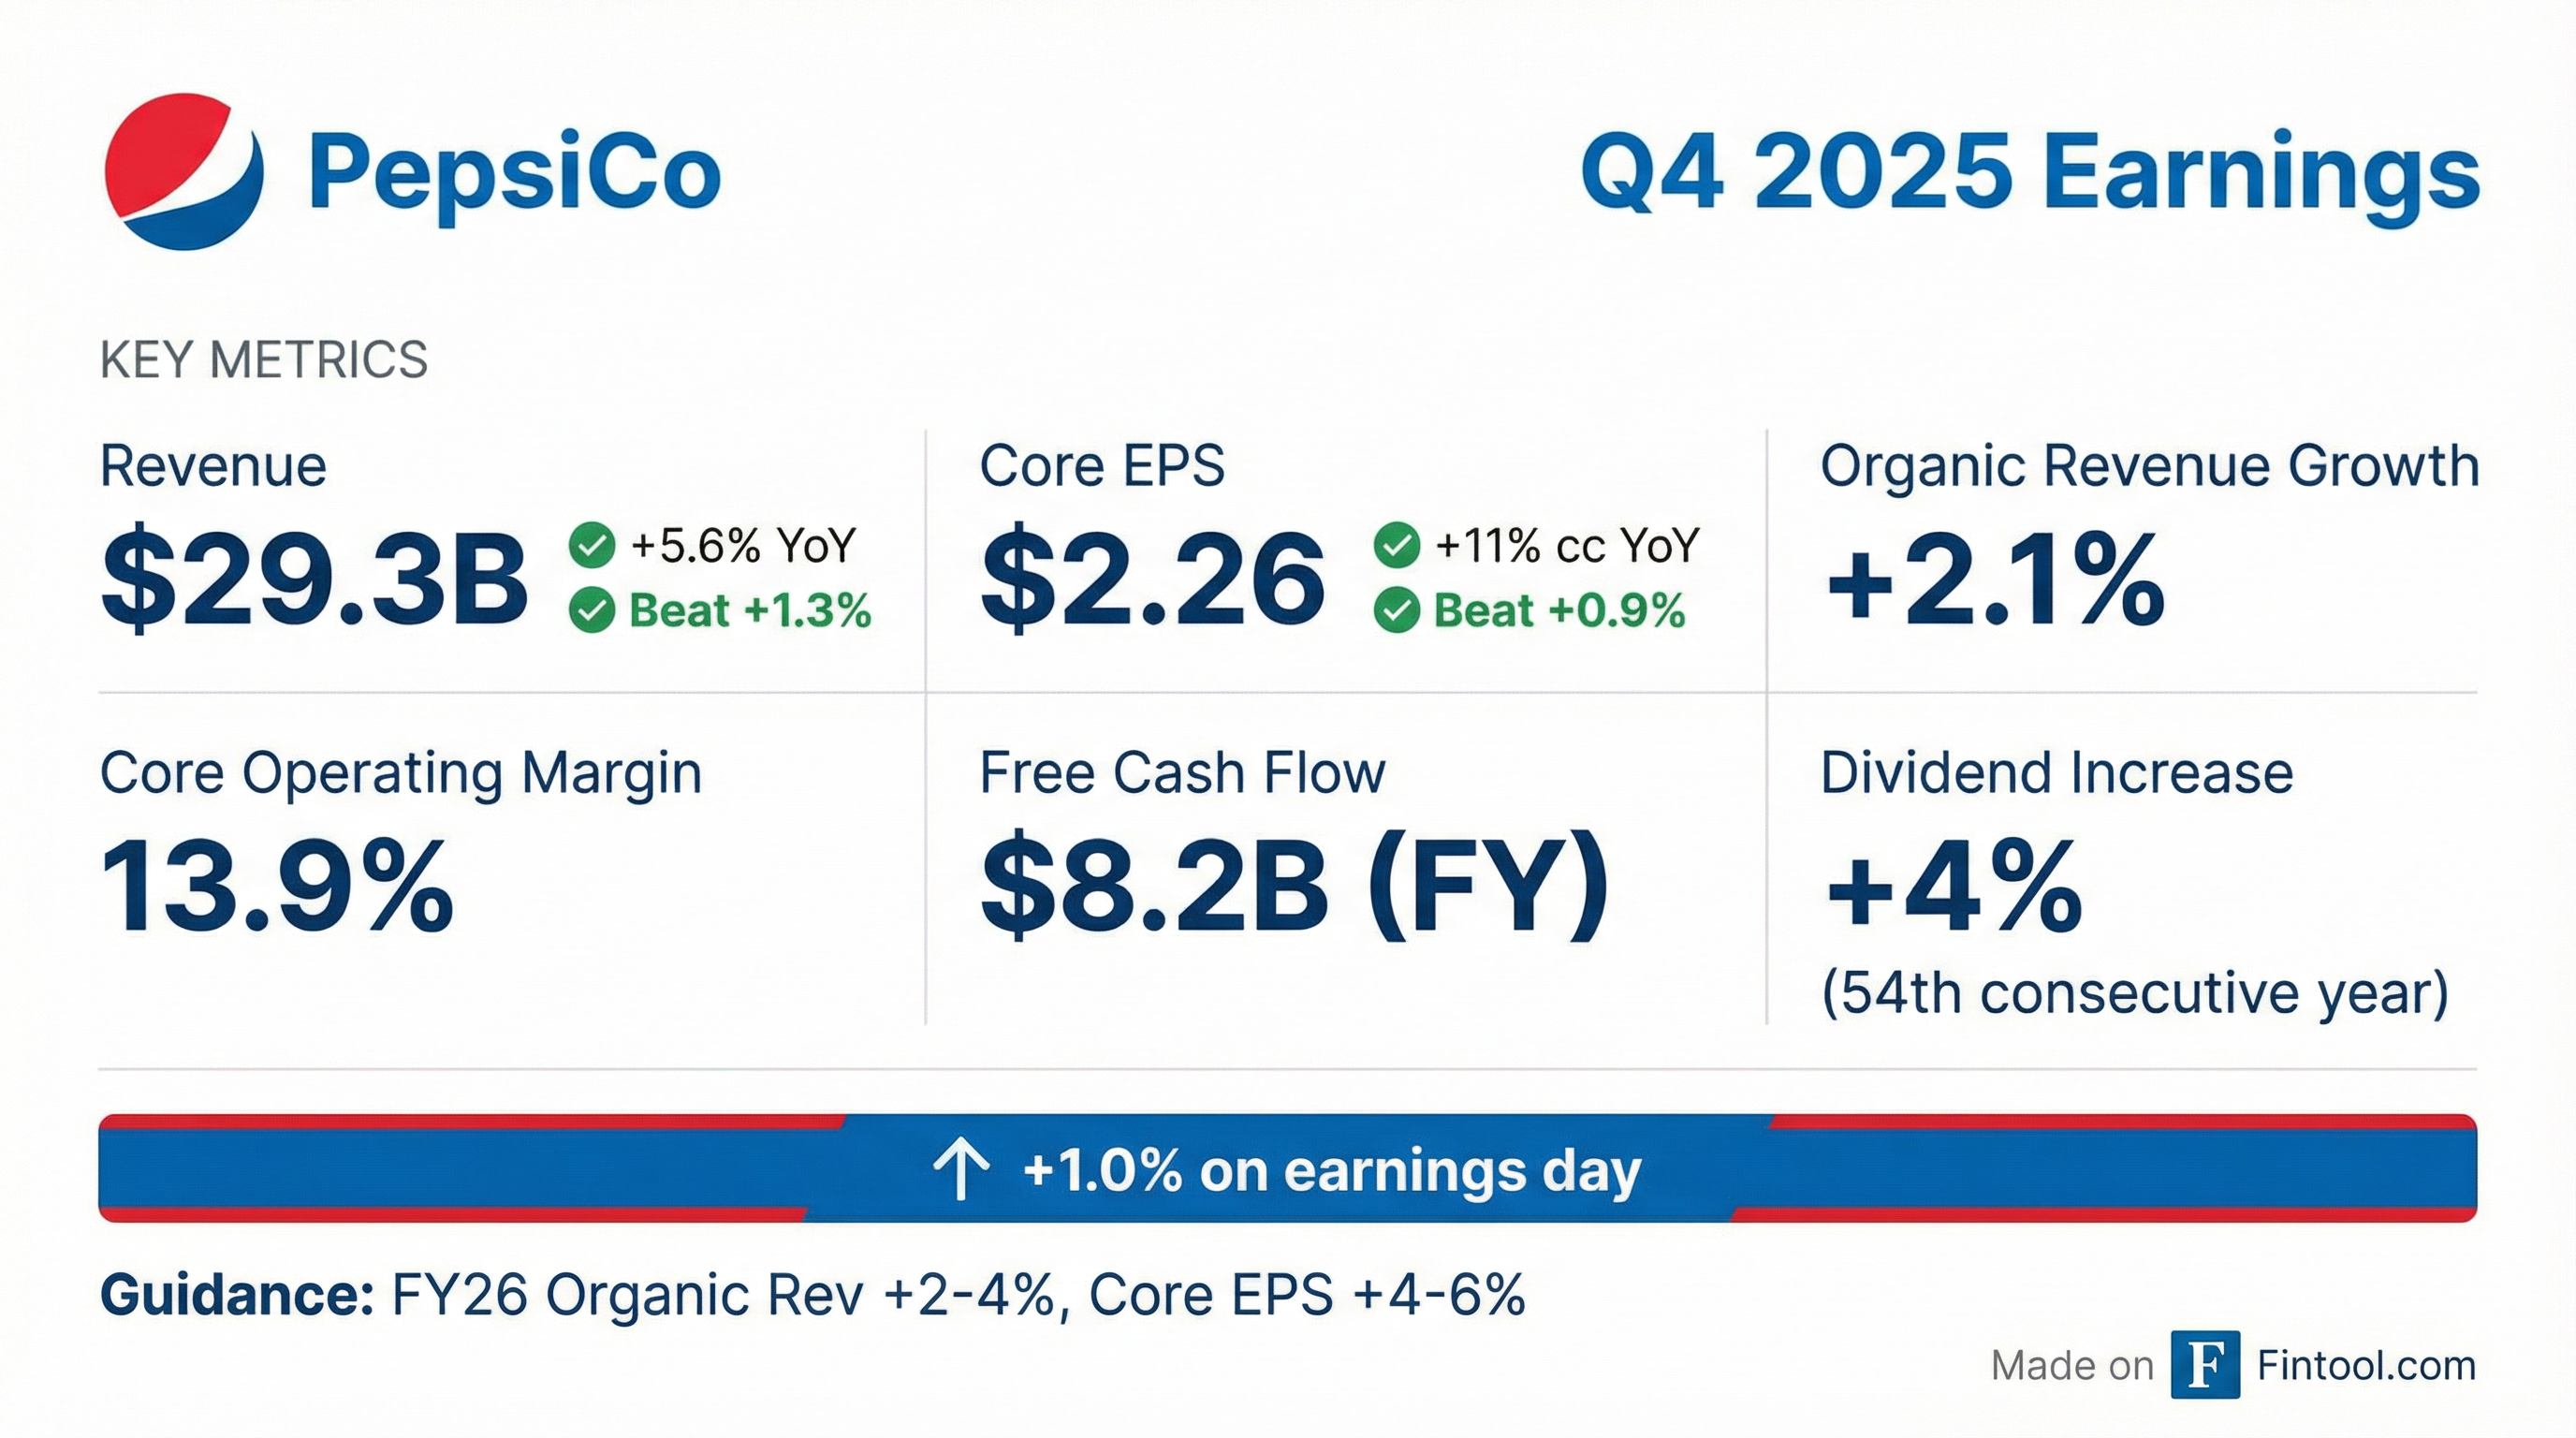
- PepsiCo reported Q4 net revenue +5.6%, organic revenue +2.1%, GAAP EPS $1.85 (+68%) and core EPS $2.26 (+11%)
- For full-year 2025, net revenue rose 2.3%, organic revenue 1.7%, GAAP EPS was $6.00 (-14%) and core EPS $8.14
- The company affirmed fiscal 2026 guidance: organic revenue +2–4%, core constant currency EPS +4–6%, core tax rate ~22%, capex <5% of net revenue and free cash flow conversion ≥80%
- Announced a 4% annual dividend increase to $5.92 per share beginning June 2026 (54th consecutive) and a $10 billion share repurchase program through February 2030
- PepsiCo has shifted its no-calorie branding from “diet” to Pepsi Zero Sugar, centering its Super Bowl ad and the bulk of its marketing spend on the formula.
- Zero Sugar products drove about half of U.S. soda category growth last year, and both Pepsi and Coca-Cola sold more Zero Sugar in early 2025 despite overall volume declines.
- U.S. soda volumes have fallen 27% over two decades, and PepsiCo’s shares have posted annual declines for three consecutive years, attracting activist investor interest.
- Torq closed a $140 million Series D, bringing total funding to $332 million and setting its valuation at $1.2 billion.
- The round was led by Merlin Ventures, with participation from existing investors Evolution Equity Partners, Notable Capital, Bessemer Venture Partners, Insight Ventures Partners and Greenfield Partners.
- The new capital will accelerate adoption of Torq’s agentic AI SOC platform and support its expansion into U.S. federal and public-sector markets.
- In 2025, Torq achieved significant revenue growth driven by mass deployment of its AI agents across Fortune 500 security operations centers.
- Siemens and NVIDIA broaden their strategic alliance to create an industrial AI operating system that spans design, construction, manufacturing, operations, and supply chains.
- The partnership will deliver an AI-accelerated portfolio including AI-native electronics development, simulation, adaptive manufacturing, and supply chain solutions, combining NVIDIA’s AI infrastructure with Siemens’ industrial hardware and software.
- Companies plan to establish the first fully AI-driven adaptive manufacturing facility in 2026 at Siemens’s electronics factory in Erlangen, using a “digital brain” powered by NVIDIA Omniverse libraries and CUDA-X.
- Siemens will integrate NVIDIA CUDA-X libraries and GPU acceleration into its electronic design automation (EDA) tools to achieve 2–10× performance improvements in verification, layout, and process optimization workflows.
- PepsiCo unveiled a multi-year collaboration with Siemens and NVIDIA to deploy advanced digital twin and AI technology across its plant and supply chain operations, marking an industry first for a global CPG company.
- Early U.S. pilot deployments using Siemens Digital Twin Composer on NVIDIA Omniverse delivered a 20 percent increase in throughput, 10–15 percent reduction in Capex, and identified 90 percent of potential issues before physical modifications.
- The initiative supports PepsiCo’s shift to a digital-first planning strategy, embedding AI and physics-based simulations to optimize facility layouts and accelerate design cycles.
- The partnership, announced at CES 2026, aims to scale these digital twin implementations globally, creating a unified, real-time view of operations with AI-driven adaptability.
- PepsiCo issued preliminary 2026 guidance early to set ambitious targets and improve internal accountability.
- Frito-Lay North America is expected to drive mid-single-digit organic revenue growth in 2026 through affordability investments, a robust innovation pipeline, and increased shelf space.
- The company aims for 100 basis points of core operating margin expansion over the next three fiscal years via structural productivity initiatives (automation, digitalization, simplification).
- CFO Steve Schmidt projects CapEx will moderate below 5% of net revenue, with a $1 billion final Tax Cuts and Jobs Act payment in 2026 and >90% free cash flow conversion by 2027.
Fintool News
In-depth analysis and coverage of PEPSICO.

Quarterly earnings call transcripts for PEPSICO.
Ask Fintool AI Agent
Get instant answers from SEC filings, earnings calls & more